UNITED STATES
SECURITIES AND EXCHANGE COMMISSION
WASHINGTON, D.C. 20549
FORM 10-Q
(Mark One)
| x | QUARTERLY REPORT PURSUANT TO SECTION 13 OR 15(d) OF THE SECURITIES EXCHANGE ACT OF 1934 |
FOR THE QUARTERLY PERIOD ENDED MARCH 31, 2014
OR
| ¨ | TRANSITION REPORT PURSUANT TO SECTION 13 OR 15(d) OF THE SECURITIES EXCHANGE ACT OF 1934 |
FOR THE TRANSITION PERIOD FROM TO
COMMISSION FILE NUMBER: 001-35795
GLADSTONE LAND CORPORATION
(Exact name of registrant as specified in its charter)
| MARYLAND | 54-1892552 | |
| (State or other jurisdiction of incorporation or organization) |
(I.R.S. Employer Identification No.) | |
| 1521 WESTBRANCH DRIVE, SUITE 100 MCLEAN, VIRGINIA |
22102 | |
| (Address of principal executive offices) | (Zip Code) | |
(703) 287-5800
(Registrant’s telephone number, including area code)
Not Applicable
(Former name, former address and former fiscal year, if changed since last report)
Indicate by check mark whether the registrant: (1) has filed all reports required to be filed by Section 13 or 15(d) of the Securities Exchange Act of 1934 during the preceding 12 months (or for such shorter period that the registrant was required to file such reports) and (2) has been subject to such filing requirements for the past 90 days. YES x NO ¨
Indicate by check mark whether the registrant has submitted electronically and posted on its corporate Web site, if any, every Interactive Data File required to be submitted and posted pursuant to Rule 405 of Regulation S-T during the preceding 12 months (or for such shorter period that the registrant was required to submit and post such files). YES x NO ¨
Indicate by check mark whether the registrant is a large accelerated filer, an accelerated filer, a non-accelerated filer, or a smaller reporting company. See the definitions of “large accelerated filer,” “accelerated filer” and “smaller reporting company” in Rule 12b-2 of the Exchange Act.
(Check one):
| Large accelerated filer | ¨ | Accelerated filer | ¨ | |||
| Non-accelerated filer | x (Do not check if a smaller reporting company) | Smaller reporting company | ¨ | |||
Indicate by check mark whether the registrant is a shell company (as defined in Rule 12b-2 of the Exchange Act). YES ¨ NO x.
The number of shares of the registrant’s Common Stock, $0.001 par value per share, outstanding as of May 5, 2014, was 6,530,264.
GLADSTONE LAND CORPORATION
FORM 10-Q FOR THE QUARTER ENDED
MARCH 31, 2014
2
PART I – FINANCIAL INFORMATION
GLADSTONE LAND CORPORATION AND SUBSIDIARIES
CONDENSED CONSOLIDATED BALANCE SHEETS
(UNAUDITED)
| March 31, 2014 |
December 31, 2013 |
|||||||
| ASSETS |
||||||||
| Real estate, at cost |
$ | 79,121,324 | $ | 78,478,053 | ||||
| Less: accumulated depreciation |
(3,426,433 | ) | (3,166,870 | ) | ||||
|
|
|
|
|
|||||
| Total real estate, net |
75,694,891 | 75,311,183 | ||||||
| Lease intangibles, net |
284,570 | 311,064 | ||||||
| Cash and cash equivalents |
13,546,471 | 16,271,282 | ||||||
| Restricted cash |
781 | 41 | ||||||
| Short-term investments |
680,611 | 680,443 | ||||||
| Deferred financing costs, net |
557,522 | 309,933 | ||||||
| Deferred offering costs |
122,968 | — | ||||||
| Other assets |
735,824 | 789,518 | ||||||
|
|
|
|
|
|||||
| TOTAL ASSETS |
$ | 91,623,638 | $ | 93,673,464 | ||||
|
|
|
|
|
|||||
| LIABILITIES AND STOCKHOLDERS’ EQUITY |
||||||||
| LIABILITIES |
||||||||
| Mortgage note payable |
$ | 41,331,998 | $ | 43,054,165 | ||||
| Borrowings under line of credit |
100,000 | 100,000 | ||||||
| Accounts payable and accrued expenses |
1,035,079 | 1,097,270 | ||||||
| Due to related parties(1) |
309,871 | 160,719 | ||||||
| Other liabilities |
901,504 | 749,318 | ||||||
|
|
|
|
|
|||||
| TOTAL LIABILITIES |
43,678,452 | 45,161,472 | ||||||
|
|
|
|
|
|||||
| Commitments and contingencies(2) |
||||||||
| STOCKHOLDERS’ EQUITY |
||||||||
| Common stock, $0.001 par value; 20,000,000 shares authorized; 6,530,264 shares issued and outstanding at both March 31, 2014, and December 31, 2013 |
6,530 | 6,530 | ||||||
| Additional paid in capital |
51,326,262 | 51,326,262 | ||||||
| Distributions in excess of earnings |
(3,387,606 | ) | (2,820,800 | ) | ||||
|
|
|
|
|
|||||
| TOTAL STOCKHOLDERS’ EQUITY |
47,945,186 | 48,511,992 | ||||||
|
|
|
|
|
|||||
| TOTAL LIABILITIES AND STOCKHOLDERS’ EQUITY |
$ | 91,623,638 | $ | 93,673,464 | ||||
|
|
|
|
|
|||||
| (1) | Refer to Note 4, “Related-Party Transactions,” for additional information |
| (2) | Refer to Note 8, “Commitments and Contingencies,” for additional information |
The accompanying notes are an integral part of these condensed consolidated financial statements.
3
GLADSTONE LAND CORPORATION AND SUBSIDIARIES
CONDENSED CONSOLIDATED STATEMENTS OF OPERATIONS
(UNAUDITED)
| For the Three Months Ended March 31, | ||||||||
| 2014 | 2013 | |||||||
| OPERATING REVENUES: |
||||||||
| Rental revenues |
$ | 1,495,636 | $ | 914,583 | ||||
|
|
|
|
|
|||||
| Total operating revenues |
1,495,636 | 914,583 | ||||||
|
|
|
|
|
|||||
| OPERATING EXPENSES: |
||||||||
| Depreciation and amortization |
288,031 | 160,036 | ||||||
| Management fee(1) |
240,964 | 59,164 | ||||||
| Incentive fee(1) |
— | 41,037 | ||||||
| Administration fee(1) |
66,158 | 38,332 | ||||||
| Professional fees |
178,987 | 85,392 | ||||||
| Acquisition-related expenses |
43,412 | 16,871 | ||||||
| Property operating expenses |
65,585 | 18,495 | ||||||
| General and administrative expenses |
217,315 | 118,778 | ||||||
|
|
|
|
|
|||||
| Total operating expenses |
1,100,452 | 538,105 | ||||||
|
|
|
|
|
|||||
| OPERATING INCOME |
395,184 | 376,478 | ||||||
|
|
|
|
|
|||||
| OTHER INCOME (EXPENSE): |
||||||||
| Interest income |
5,648 | 10,627 | ||||||
| Other income |
749 | — | ||||||
| Interest expense |
(374,040 | ) | (280,400 | ) | ||||
|
|
|
|
|
|||||
| Total other expense |
(367,643 | ) | (269,773 | ) | ||||
|
|
|
|
|
|||||
| Net income before income taxes |
27,541 | 106,705 | ||||||
|
|
|
|
|
|||||
| Income tax provision |
(6,623 | ) | (59,189 | ) | ||||
|
|
|
|
|
|||||
| NET INCOME |
$ | 20,918 | $ | 47,516 | ||||
|
|
|
|
|
|||||
| EARNINGS PER COMMON SHARE: |
||||||||
| Basic and diluted |
$ | 0.00 | $ | 0.01 | ||||
|
|
|
|
|
|||||
| Distributions per common share |
$ | 0.09 | $ | 0.08 | ||||
|
|
|
|
|
|||||
| WEIGHTED AVERAGE SHARES OF COMMON STOCK OUTSTANDING—basic and diluted |
6,530,264 | 5,249,898 | ||||||
|
|
|
|
|
|||||
| (1) | Refer to Note 4, “Related-Party Transactions,” for additional information |
The accompanying notes are an integral part of these condensed consolidated financial statements.
4
GLADSTONE LAND CORPORATION AND SUBSIDIARIES
CONDENSED CONSOLIDATED STATEMENTS OF CASH FLOWS
(UNAUDITED)
| For the Three Months Ended March 31, | ||||||||
| 2014 | 2013 | |||||||
| CASH FLOWS FROM OPERATING ACTIVITIES: |
||||||||
| Net income |
$ | 20,918 | $ | 47,516 | ||||
| Adjustments to reconcile net income to net cash provided by (used in) operating activities: |
||||||||
| Depreciation and amortization |
288,031 | 160,036 | ||||||
| Amortization of deferred financing fees |
7,975 | 7,404 | ||||||
| Amortization of deferred rent assets and liabilities, net |
(19,894 | ) | (29,061 | ) | ||||
| Changes in operating assets and liabilities: |
||||||||
| Other assets |
53,526 | (2,425,907 | ) | |||||
| Accounts payable, accrued expenses, and due to related parties |
(128,877 | ) | (425,439 | ) | ||||
| Other liabilities |
172,080 | 103,883 | ||||||
|
|
|
|
|
|||||
| Net cash provided by (used in) operating activities |
393,759 | (2,561,568 | ) | |||||
| CASH FLOWS FROM INVESTING ACTIVITIES: |
||||||||
| Capital expenditures on exisiting real estate |
(503,299 | ) | — | |||||
| Increase in restricted cash |
(740 | ) | — | |||||
| Purchase of U.S. Treasuries |
— | (19,996,767 | ) | |||||
| Deposits on future acquisitions |
(50,000 | ) | (50,000 | ) | ||||
| Deposits refunded |
50,000 | — | ||||||
|
|
|
|
|
|||||
| Net cash used in investing activities |
(504,039 | ) | (20,046,767 | ) | ||||
| CASH FLOWS FROM FINANCING ACTIVITIES: |
||||||||
| Proceeds from issuance of equity |
— | 56,703,960 | ||||||
| Offering costs |
(84,140 | ) | (4,130,898 | ) | ||||
| Repayments on mortgage note payable |
(1,722,167 | ) | (1,228,715 | ) | ||||
| Financing fees |
(220,500 | ) | (12,230 | ) | ||||
| Distributions paid |
(587,724 | ) | (522,421 | ) | ||||
|
|
|
|
|
|||||
| Net cash (used in) provided by financing activities |
(2,614,531 | ) | 50,809,696 | |||||
|
|
|
|
|
|||||
| NET (DECREASE) INCREASE IN CASH AND CASH EQUIVALENTS |
(2,724,811 | ) | 28,201,361 | |||||
| CASH AND CASH EQUIVALENTS AT BEGINNING OF PERIOD |
16,271,282 | 873,474 | ||||||
|
|
|
|
|
|||||
| CASH AND CASH EQUIVALENTS AT END OF PERIOD |
$ | 13,546,471 | $ | 29,074,835 | ||||
|
|
|
|
|
|||||
| NON-CASH OPERATING, INVESTING AND FINANCING INFORMATION: |
||||||||
| Additions to real estate included in accounts payable and accrued expenses |
$ | 141,946 | $ | — | ||||
|
|
|
|
|
|||||
| Offering costs included in accounts payable and accrued expenses |
38,828 | 237,021 | ||||||
|
|
|
|
|
|||||
| Financing fees included in accounts payable and accrued expenses |
35,064 | — | ||||||
|
|
|
|
|
|||||
The accompanying notes are an integral part of these condensed consolidated financial statements.
5
GLADSTONE LAND CORPORATION AND SUBSIDIARIES
NOTES TO CONDENSED CONSOLIDATED FINANCIAL STATEMENTS
(UNAUDITED)
NOTE 1. BUSINESS AND ORGANIZATION
Business
Gladstone Land Corporation (the “Company,” “we,” “us” or “our”) was re-incorporated in Maryland on March 24, 2011, having been previously re-incorporated in Delaware on May 25, 2004, and having been originally incorporated in California on June 14, 1997. We are primarily in the business of owning and leasing farmland. Subject to certain restrictions and limitations, and pursuant to contractual agreements, our business is managed by Gladstone Management Corporation (the “Adviser”), a Delaware corporation, and administrative services are provided to us by Gladstone Administration, LLC (the “Administrator”), a Delaware limited liability company.
Organization
We conduct substantially all of our operations through a subsidiary, Gladstone Land Limited Partnership (the “Operating Partnership”), a Delaware limited partnership. As we currently own, directly or indirectly, all of the general and limited partnership interests of the Operating Partnership, the financial position and results of operations of the Operating Partnership are consolidated with those of the Company.
Gladstone Land Partners, LLC (“Land Partners”), a Delaware limited liability company and a subsidiary of ours, was organized to engage in any lawful act or activity for which a limited liability company may be organized in Delaware. Land Partners is the general partner of the Operating Partnership and has the power to make and perform all contracts and to engage in all activities necessary in carrying out the purposes of the Company, as well as all other powers available to it as a limited liability company. As we currently own all of the membership interests of Land Partners, the financial position and results of operations of Land Partners are consolidated with those of the Company.
Gladstone Land Advisers, Inc. (“Land Advisers”), a Delaware corporation and a subsidiary of ours, was created to collect any non-qualifying income related to our real estate portfolio. We have elected for Land Advisers to be taxed as a taxable REIT subsidiary (“TRS”). It is currently anticipated that this income will predominately consist of fees we receive related to the leasing of real estate. We may also provide ancillary services to farmers through this subsidiary, though there have been no such fees earned to date. Since we currently own 100% of the voting securities of Land Advisers, the financial position and results of operations of Land Advisers are consolidated with those of the Company.
All subsequent references in this report to the “Company,” “we,” “us” and “our” refer, collectively, to Gladstone Land Corporation, the Operating Partnership and the Company’s and the Operating Partnership’s subsidiaries, unless the context otherwise requires or where otherwise indicated.
NOTE 2. SUMMARY OF SIGNIFICANT ACCOUNTING POLICIES
Interim Financial Information
Our interim financial statements are prepared in accordance with accounting principles generally accepted in the United States of America (the “U.S.”) (“GAAP”) for interim financial information and pursuant to the requirements for reporting on Form 10-Q in accordance with Article 10 of Regulation S-X. Accordingly, certain disclosures accompanying annual financial statements prepared in accordance with GAAP are omitted. In the opinion of our management, all adjustments, consisting solely of normal recurring accruals, necessary for the fair presentation of financial statements for the interim period have been included. The results of the interim period reported herein are not indicative of the results to be expected for the full year. The interim financial statements and accompanying notes should be read in conjunction with the financial statements and notes thereto included in our Form 10-K for the year ended December 31, 2013, as filed with the Securities and Exchange Commission on February 24, 2014.
6
Out-of-Period Adjustment
During the three months ended September 30, 2013, and the three months ended December 31, 2013, we recorded adjustments to our income tax provision and to other assets that were related to our 2011 and 2012 provision reconciliation. As a result of the correction of these errors, we understated net income by $30,800 for the both three and nine months ended September 30, 2013, and by $9,638 and $40,438 for the three months and year ended December 31, 2013, respectively. We concluded that these adjustments were not material to the 2011, 2012 or 2013 results of operations; as such, these adjustments were recorded during 2013, with no impact on the three months ended March 31, 2013.
Use of Estimates
The preparation of financial statements in accordance with GAAP requires management to make estimates and assumptions that affect the reported amounts of assets and liabilities and disclosure of contingent assets and liabilities at the date of the financial statements and the reported amounts of revenues and expenses during the reporting periods. Actual results could materially differ from those estimates.
Real Estate and Lease Intangibles
Our investments in real estate consist of farmland and improvements made to the farmland, consisting of buildings; irrigation and drain systems; coolers, which are storage facilities used for cooling crops; box barns, which are facilities used for storing and assembling boxes; and horticulture acquired in connection with the land purchase, which currently consists of blueberry bushes and lemon trees. We record investments in real estate at cost and capitalize improvements and replacements when they extend the useful life or improve the efficiency of the asset. We expense costs of repairs and maintenance as such costs are incurred. We compute depreciation using the straight-line method over the shorter of the estimated useful life or 39 years for buildings and improvements, the shorter of the estimated useful life or 25 years for horticulture acquired in connection with the purchase of farmland, 5 to 7 years for equipment and fixtures and the shorter of the useful life or the remaining lease term for leasehold interests.
Certain of our acquisitions involve sale-leaseback transactions with newly-originated leases, which we account for as asset acquisitions under Accounting Standards Codification (“ASC”) 360, “Property, Plant and Equipment.” In the case of an asset acquisition, we will capitalize the transaction costs incurred in connection with the acquisition. Other of our acquisitions involve the acquisition of farmland that is already being operated as rental property and has a lease in place that we assume at the time of acquisition, which we will generally consider to be a business combination under ASC 805, “Business Combinations.” When an acquisition is considered a business combination, ASC 805 requires that the purchase price of real estate be allocated to the tangible assets acquired and liabilities assumed, consisting of land, buildings, improvements, horticulture and long-term debt; and identifiable intangible assets and liabilities, typically the value of above-market and below-market leases, in-place leases, unamortized lease origination costs and tenant relationships, based in each case on their fair values. ASC 805 also requires that all expenses related to the acquisition be expensed as incurred, rather than capitalized into the cost of the acquisition.
Whether our acquisitions are treated as an asset acquisition under ASC 360 or a business combination under ASC 805, the fair value of the purchase price is allocated among the assets acquired and any liabilities assumed. Management’s estimates of fair value are made using methods similar to those used by independent appraisers, such as a sales comparison approach, a cost approach, and an income capitalization approach (utilizing a discounted cash flow analysis). Factors considered by management in its analysis include an estimate of carrying costs during hypothetical, expected lease-up periods, taking into consideration current market conditions and costs to execute similar leases. We also consider information obtained about each property as a result of our pre-acquisition due diligence, marketing and leasing activities in estimating the fair value of the tangible and intangible assets acquired and liabilities assumed. In estimating carrying costs, management also includes real estate taxes, insurance and other operating expenses and estimates of lost rental income at market rates during the hypothetical, expected lease-up periods, which typically range from 3 to 12 months, depending on specific local market conditions. Management also estimates costs to execute similar leases, including leasing commissions, legal and other related expenses, to the extent that such costs are not already incurred in connection with a new lease origination as part of the transaction.
We allocate purchase price to the fair value of the tangible assets and liabilities of an acquired property by valuing the property as if it were vacant. The “as-if-vacant” value is allocated to land, buildings, improvements and horticulture, based on management’s determination of the fair values of these assets. Real estate depreciation expense on these tangible assets was $259,563 and $135,055 for the three months ended March 31, 2014 and 2013, respectively.
We record above-market and below-market in-place lease values for acquired properties based on the present value (using an interest rate that reflects the risks associated with the leases acquired) of the difference between (i) the contractual amounts to be paid pursuant to the in-place leases and (ii) management’s estimate of fair market lease rates for the corresponding in-place leases, measured over a period equal to the remaining, non-cancelable term of the lease. When determining the non-cancelable term of the lease, we evaluate if fixed-rate renewal options, if any, should be included.
7
In connection with our 2013 and 2012 acquisitions, we allocated $161,547 and $98,808, respectively, of the purchase price to below-market lease values. Prior to 2012, all acquired leases were determined to be at market. The fair value of capitalized below-market leases, included as part of Other liabilities in the accompanying Condensed Consolidated Balance Sheets, are amortized into rental income on a straight-line basis over the remaining, non-cancelable terms of the respective leases. Total amortization related to below-market lease values recorded for the three months ended March 31, 2014 and 2013 was $19,984 and $29,061, respectively.
The total amount of the remaining intangible assets acquired, which consists of in-place lease values, unamortized lease origination costs and tenant relationship intangible values, are allocated based on management’s evaluation of the specific characteristics of each tenant’s lease and our overall relationship with that respective tenant. Characteristics to be considered by management in allocating these values include the nature and extent of our existing business relationships with the tenant, prospects for developing additional business with the tenant, the tenant’s credit quality and our expectations of lease renewals (including those existing under the terms of the lease agreement), among other factors.
The value of in-place leases and unamortized lease origination costs are amortized to expense on a straight-line basis over the remaining terms of the respective leases, which currently range from 1 to 15 years. The value of customer relationship intangibles, which is the benefit to us resulting from the likelihood of an existing tenant renewing its lease at the existing property or entering a lease at a different property owned by us, are amortized to expense over the remaining lease term and any anticipated renewal periods in the respective leases. Should a tenant terminate its lease, the unamortized portion of the above-market and below-market lease values, in-place lease values, lease origination costs and tenant relationship intangibles will be immediately charged to the related income or expense.
Total amortization expense related to these intangible assets, in aggregate, was $28,468 and $24,981 for the three months ended March 31, 2014 and 2013, respectively.
Impairment of Real Estate Assets
We account for the impairment of real estate, including intangible assets, in accordance with ASC 360-10-35, “Property, Plant, and Equipment,” which requires us to periodically review the carrying value of each property to determine whether circumstances indicate impairment of the carrying value of the investment exists or if depreciation periods should be modified. If circumstances support the possibility of impairment, we prepare a projection of the undiscounted future cash flows, without interest charges, of the specific property and determine whether the carrying value of the investment in such property is recoverable. In performing the analysis, we consider such factors as the tenants’ payment history and financial condition, the likelihood of lease renewal, agricultural and business conditions in the regions in which our farms are located and whether there are indications that the fair value of the real estate has decreased. If the carrying amount is more than the aggregate undiscounted future cash flows, we would recognize an impairment loss to the extent the carrying amount exceeds the estimated fair value of the property.
We evaluate our entire property portfolio each quarter for any impairment indicators and perform an impairment analysis on those select properties that have an indication of impairment. We concluded that none of our properties were impaired as of March 31, 2014, and will continue to monitor our portfolio for any indicators of impairment. There have been no impairments recognized on real estate assets since our inception.
Restricted Cash
Restricted cash as of March 31, 2014, and December 31, 2013, consisted solely of accrued interest owed on funds held in escrow related to the acquisition of a property in December 2013.
Short-term Investments
We consider short-term investments to consist of any highly-liquid securities that have an original maturity of less than one year but greater than three months at the time of purchase. As of March 31, 2014, and December 31, 2013, short-term investments consisted of approximately $0.7 million held in a certificate of deposit (“CD”). The CD originally matured on September 6, 2013; however, upon maturity, the balance was rolled into a new, 12-month CD with a maturity date of September 6, 2014. Due to the short-term nature of the CD, the amortized cost of the security was deemed to approximate its fair value as of both March 31, 2014 and December 31, 2013. During the three months ended March 31, 2013, we also held
8
$20.0 million of short-term U.S. Treasury Bills that matured on June 27, 2013, and were subsequently invested in a money-market deposit account. As of both March 31, 2014, and December 31, 2013, our short-term investments were classified as held-to-maturity and were recorded at their amortized cost on the Condensed Consolidated Balance Sheets. Total income earned on these short-term investments is included in Interest income on the accompanying Condensed Consolidated Statements of Operations and totaled $168 and $1,787 for the three months ended March 31, 2014 and 2013, respectively.
Deferred Financing Costs
Deferred financing costs consist of costs incurred to obtain financing, including legal fees, origination fees and administrative fees. These costs are deferred and amortized over the term of the related financing using the straight-line method due to the revolving nature of the financing instrument. Upon early extinguishment of any borrowings, the unamortized portion of the related deferred financing costs will be immediately charged to expense. Total amortization expense related to deferred financing costs is included in Interest expense on the accompanying Condensed Consolidated Statements of Operations. Accumulated amortization of deferred financing costs was $72,123 and $64,148 as of March 31, 2014, and December 31, 2013, respectively. During the three months ended March 31, 2014, we incurred $255,564 of additional financing fees in connection with our negotiations regarding a new mortgage loan and credit facility with Metropolitan Life Insurance Company (“MetLife”)
Deferred Offering Costs
We account for deferred offering costs in accordance with SEC Staff Accounting Bulletin (“SAB”), Topic 5.A, which states that incremental costs directly attributable to a proposed or actual offering of securities may properly be deferred and charged against the gross proceeds of the offering. Accordingly, we record costs incurred related to public offerings of equity securities on our Condensed Consolidated Balance Sheet and pro-ratably apply these amounts to the proceeds of equity as stock is issued. The deferred offering costs on our Condensed Consolidated Balance Sheet as of March 31, 2014, are related to the filing and preparation of a registration statement on Form S-3, which was declared effective by the U.S. Securities and Exchange Commission (the “SEC”) on April 2, 2014.
Other Assets
Other assets consist primarily of income taxes receivable, deferred rent, prepaid expenses, deposits on potential real estate acquisitions and other miscellaneous receivables.
Revenue Recognition
Rental revenue includes rents that each tenant pays in accordance with the terms of its respective lease, reported evenly over the non-cancelable term of the lease. Some of our leases contain rental increases at specified intervals; we recognize such revenues on a straight-line basis. Deferred rent receivable, included in Other assets on the accompanying Condensed Consolidated Balance Sheets, includes the cumulative difference between rental revenue, as recorded on a straight-line basis, and rents received from the tenants in accordance with the lease terms. Capitalized above-market leases and capitalized below-market leases are included in Other assets and Other liabilities, respectively, on the accompanying Condensed Consolidated Balance Sheets, the value of which is amortized into rental income over the life of the respective leases. In addition, we determine, in our judgment, to what extent the deferred rent receivable applicable to each specific tenant is collectable. We periodically review deferred rent receivable, as it relates to straight-line rents, and take into consideration the tenant’s payment history, the financial condition of the tenant, business conditions of the industry in which the tenant operates and economic and agricultural conditions in the geographic area in which the property is located. In the event that the collectability of deferred rent with respect to any given tenant is in doubt, we record an allowance for uncollectable accounts or record a direct write-off of the specific rent receivable. No such reserves or direct write-offs have been recorded to date.
Income Taxes
We believe that we have completed all significant actions necessary to convert to a real estate investment trust (“REIT”), effective January 1, 2013, including the distribution of all accumulated earnings and profits from prior years. Therefore, beginning with our taxable year ended December 31, 2013, we intend to elect to be taxed as a REIT for federal income tax purposes. As a REIT, we generally will not be subject to federal income taxes on amounts that we distribute to our
9
stockholders (except income from any foreclosure property), provided that, on an annual basis, we distribute at least 90% of our REIT taxable income (determined without regard to the deduction for dividends paid and excluding net capital gains) to our stockholders and meet certain other conditions. To the extent that we satisfy the annual distribution requirement but distribute less than 100% of our taxable income, we will be subject to an excise tax on our undistributed taxable income. For all tax years prior to 2013, our net income was taxed at regular corporate tax rates for both federal and state purposes.
In connection with intercompany transfers of the farmland now held by San Andreas Road Watsonville, LLC (“San Andreas”), a wholly-owned subsidiary of ours, in 2002 and again in 2004 and of the farmland currently held by West Gonzales Road Oxnard, LLC (“West Gonzales”), a wholly-owned subsidiary of ours, in 2002, we created deferred intercompany gains that are taxable for both federal and state income tax purposes upon the occurrence of certain triggering events. These deferred intercompany gains are generally equal to the excess of the fair market value of the property over the tax basis of the property (determined as of the time that the deferred intercompany gain was created) and are deferred indefinitely until a triggering event occurs (such as REIT conversion), generally when the transferee or the transferor leaves the consolidated group, as defined by the relevant tax law, or the property is sold to a third party. In the case of a transfer of built-in gain property between members of a consolidated group, there are deferred intercompany gains to the transferring entity, and the receiving entity’s tax basis is the fair market value at the date of transfer. Thus, a deferred tax liability is created related to the deferred intercompany gain to the transferring entity, and an offsetting deferred tax asset is created representing the basis difference from the new tax basis of the receiving entity. As a result, the deferred tax assets and liabilities offset one another and there is no net impact to us. In accordance with ASC 740 and ASC 810, no tax impact is recognized in the condensed consolidated financial statements as a result of transfers of assets between members of a consolidated group.
As a result of the transfers mentioned above, the related federal and state deferred tax assets and liabilities each totaled approximately $2.2 million as of December 31, 2013. With respect to the federal portion of approximately $2.1 million, this amount will become payable as of the effective date of our REIT election, and, as a REIT, we will no longer be able to obtain the benefit of the related deferred tax asset. As such, in March 2013, we made a tax prepayment of $2.1 million in the form of a cash bond submitted to the Internal Revenue Service (“IRS”) to cover this amount once it becomes due. Since we believe that we have completed all significant actions necessary to qualify as a REIT and intend to make an election to be treated as a REIT effective as of January 1, 2013, we reversed the $2.1 million deferred tax asset through our income tax provision during the year ended December 31, 2013. The REIT election does not have the same impact on the state tax amount of approximately $0.1 million, and, therefore, this amount will continue to be deferred.
At the time of transfer of San Andreas in February 2004 from SC Land, Inc. (“SC Land”), a deferred intercompany stock account (“DISA”) was created at the state income tax level. The DISA is calculated based upon the fair market value of the property at the time of distribution, resulting in a tax liability of approximately $98,000. SC Land was formally liquidated in June 2010; however, we have concluded that SC Land was de facto liquidated in May 2009, when it transferred its remaining existing assets to the parent company, since the business operations of SC Land were effectively terminated as of that date. The California state income taxes of $98,000 related to the DISA became payable at the time of the de facto liquidation in May 2009 and are being remitted by us in equal installments over a five-year period, the final installment of which will be made in 2014.
We transferred West Gonzales from SC Land into the parent company in May 2009. As stated in the paragraph above, we have concluded that SC Land was de facto liquidated in May 2009, and, as a result, we will not be subject to a tax on the transfer similar to that discussed in the paragraphs above related to the 2002 and 2004 transfers.
10
A reconciliation between the U.S. statutory federal income tax rate and our effective income tax rate for the three months ended March 31, 2014 and 2013 is provided in the following table:
| Three Months Ended March 31, 2014 |
Three Months Ended March 31, 2013 |
|||||||
| U.S. statutory federal income tax rate |
0.0 | % | 34.0 | % | ||||
| State taxes, net of U.S. federal income tax benefit |
0.0 | % | 21.4 | % | ||||
| Other adjustments(1) |
24.0 | % | 0.1 | % | ||||
|
|
|
|
|
|||||
| Effective tax rate |
24.0 | % | 55.5 | % | ||||
|
|
|
|
|
|||||
| (1) | Adjustments made to the 2014 income tax provision relate to the remaining DISA owed to the state of California, as a result of the land transfers from prior years, mentioned above. |
The provision for income taxes included in our Condensed Consolidated Financial Statements for both 2014 and 2013 were all current.
Also, beginning with our tax year ended December 31, 2013, we intend for Land Advisers to be treated as a TRS and to be subject to federal and state income taxes. Though Land Advisers has had no activity to date, we would account for any future income taxes in accordance with the provisions of ASC 740, “Income Taxes.” Under ASC 740-10-25, we account for income taxes using the asset and liability method, under which deferred tax assets and liabilities are recognized for the future tax consequences attributable to differences between the financial statement carrying amounts of existing assets and liabilities and their respective tax bases.
Comprehensive Income
For the three months ended March 31, 2014 and 2013, comprehensive income equaled net income; therefore, a separate statement of comprehensive income is not included in the accompanying Condensed Consolidated Financial Statements.
Recently Issued Accounting Guidance
The Financial Accounting Standards Board (the “FASB”) issued Accounting Standards Update No. 2014-08, “Presentation of Financial Statements (Topic 205) and Property, Plant, and Equipment (Topic 360): Reporting Discontinued Operations and Disclosures of Disposals of Components of an Entity.” Under this revised guidance, only disposals representing a strategic shift in operations, such as a disposal of a major geographic area, a major line of business or a major equity method investment, will be presented as discontinued operations. As an emerging growth company, the standard is effective for us with respect to (a) all disposals (or classifications as held for sale) of components of an entity that occur within annual periods beginning on or after December 15, 2014, and interim periods within annual periods beginning on or after December 15, 2015, and (b) all activities that, upon acquisition, are classified as held for sale that occur within annual periods beginning on or after December 15, 2014, and interim periods within annual periods beginning on or after December 15, 2015. We currently anticipate that this standard will not have a significant impact on our financial position, results of operations or cash flows.
11
NOTE 3. REAL ESTATE AND INTANGIBLE ASSETS
All of our properties are wholly-owned on a fee-simple basis. The following table provides certain summary information about our 21 farms as of March 31, 2014:
| Number | Lease | |||||||||||||||||||||||||||||||
| Date | of | Total | Farmable | Expiration | Net Cost | |||||||||||||||||||||||||||
| Property Name |
Location | Acquired | Farms | Acres | Acres | Date | Basis(1) | Encumbrances | ||||||||||||||||||||||||
| San Andreas |
Watsonville, CA | 6/16/1997 | 1 | 307 | 237 | 12/31/2014 | $ | 4,855,100 | $ | 100,000 | (2) | |||||||||||||||||||||
| West Gonzales |
Oxnard, CA | 9/15/1998 | 1 | 653 | 502 | 6/30/2020 | 12,339,049 | 26,784,299 | ||||||||||||||||||||||||
| West Beach |
Watsonville, CA | 1/3/2011 | 3 | 196 | 195 | 12/31/2023 | 8,383,970 | 4,997,773 | ||||||||||||||||||||||||
| Dalton Lane |
Watsonville, CA | 7/7/2011 | 1 | 72 | 70 | 10/31/2015 | 2,718,326 | 1,648,264 | ||||||||||||||||||||||||
| Keysville Road |
Plant City, FL | 10/26/2011 | 2 | 59 | 50 | 7/1/2016 | 1,230,758 | 880,644 | ||||||||||||||||||||||||
| Colding Loop |
Wimauma, FL | 8/9/2012 | 1 | 219 | 181 | 6/14/2018 | 3,980,623 | 2,089,764 | ||||||||||||||||||||||||
| Trapnell Road |
Plant City, FL | 9/12/2012 | 3 | 124 | 110 | 6/30/2017 | 4,227,983 | 2,317,577 | ||||||||||||||||||||||||
| 38th Avenue |
Covert, MI | 4/5/2013 | 1 | 119 | 89 | 4/4/2020 | 1,343,135 | 788,813 | ||||||||||||||||||||||||
| Sequoia Street |
Brooks, OR | 5/31/2013 | 1 | 218 | 206 | 5/31/2028 | 3,176,000 | 1,824,864 | ||||||||||||||||||||||||
| Natividad Road |
Salinas, CA | 10/21/2013 | 1 | 166 | 166 | 10/31/2024 | 7,456,086 | — | ||||||||||||||||||||||||
| 20th Avenue |
South Haven, MI | 11/5/2013 | 3 | 151 | 94 | 11/4/2018 | 1,994,669 | — | ||||||||||||||||||||||||
| Broadway Road |
Moorpark, CA | 12/16/2013 | 1 | 60 | 60 | 12/15/2023 | 3,001,717 | — | ||||||||||||||||||||||||
| Oregon Trail |
Echo, OR | 12/27/2013 | 1 | 1,895 | 1,640 | 12/31/2023 | 14,049,596 | — | ||||||||||||||||||||||||
| East Shelton |
Willcox, AZ | 12/27/2013 | 1 | 1,761 | 1,320 | 2/29/2024 | 7,222,449 | — | ||||||||||||||||||||||||
|
|
|
|
|
|
|
|
|
|
|
|||||||||||||||||||||||
| 21 | 6,000 | 4,920 | $ | 75,979,461 | $ | 41,431,998 | ||||||||||||||||||||||||||
|
|
|
|
|
|
|
|
|
|
|
|||||||||||||||||||||||
| (1) | Consists of the initial acquisition price (including the costs allocated to both tangible and intangible assets), plus subsequent improvements and other capitalized costs associated with the properties, and adjusted for depreciation and amortization accumulated through March 31, 2014. |
| (2) | Represents borrowings outstanding on our line of credit as of March 31, 2014, under which San Andreas is pledgd as collateral. |
Real Estate
The following table sets forth the components of our investments in tangible real estate assets as of March 31, 2014, and December 31, 2013:
| March 31, 2014 | December 31, 2013 | |||||||
| Real estate: |
||||||||
| Land and land improvements |
$ | 63,993,859 | $ | 63,944,307 | ||||
| Buildings and improvements |
2,193,604 | 2,193,255 | ||||||
| Coolers |
5,388,051 | 5,293,796 | ||||||
| Irrigation system |
6,506,836 | 6,007,845 | ||||||
| Horticulture |
1,038,974 | 1,038,850 | ||||||
|
|
|
|
|
|||||
| Real estate, gross |
79,121,324 | 78,478,053 | ||||||
| Accumulated depreciation |
(3,426,433 | ) | (3,166,870 | ) | ||||
|
|
|
|
|
|||||
| Real estate, net |
$ | 75,694,891 | $ | 75,311,183 | ||||
|
|
|
|
|
|||||
Existing Real Estate Activity
On January 20, 2014, we completed the work for the expansion and upgrade of the cooling facility on Trapnell Road, for which we agreed to incur the costs, up to a maximum of $450,000. We expended a total of $446,108 in connection with this project, and, in accordance with the lease amendment executed on October 21, 2013, we will earn additional rental income on the costs incurred related to this project at an initial annual rate of 8.5%, with prescribed rental escalations provided for in the lease.
12
On March 27, 2014, we executed a lease with a new tenant to occupy West Beach that commences on November 1, 2014, as the lease term with the current tenants on the property will expire on October 31, 2014. The new lease term is for nine years, through December 31, 2023, and provides for prescribed rent escalations over its life, with minimum annualized GAAP straight-line rental income of $540,469, representing a 21% increase over that of the current lease.
Intangible Assets
The following table summarizes the carrying value of intangible assets and the accumulated amortization for each intangible asset class as of March 31, 2014, and December 31, 2013:
| March 31, 2014 | December 31, 2013 | |||||||||||||||
| Lease Intangibles |
Accumulated Amortization |
Lease Intangibles |
Accumulated Amortization |
|||||||||||||
| In-place leases |
$ | 397,728 | $ | (260,098 | ) | $ | 397,728 | $ | (241,697 | ) | ||||||
| Leasing commissions |
148,532 | (42,409 | ) | 146,558 | (34,727 | ) | ||||||||||
| Customer relationships |
93,187 | (52,370 | ) | 93,187 | (49,985 | ) | ||||||||||
|
|
|
|
|
|
|
|
|
|||||||||
| $ | 639,447 | $ | (354,877 | ) | $ | 637,473 | $ | (326,409 | ) | |||||||
|
|
|
|
|
|
|
|
|
|||||||||
The aggregate amortization expense for the remainder of 2014 and each of the five succeeding fiscal years and thereafter is as follows:
| Period |
Estimated Amortization Expense |
|||||||
| For the remaining nine months ending December 31: |
2014 | $ | 85,423 | |||||
| For the fiscal years ending December 31: |
2015 | 100,920 | ||||||
| 2016 | 34,948 | |||||||
| 2017 | 23,869 | |||||||
| 2018 | 10,110 | |||||||
| 2019 | 7,150 | |||||||
| Thereafter | 22,150 | |||||||
|
|
|
|||||||
| $ | 284,570 | |||||||
|
|
|
|||||||
Lease Expirations
The following table summarizes the lease expirations by year for our properties with leases in place as of March 31, 2014:
| Year |
Number of Expiring Leases |
Expiring Leased Acreage |
% of Total Acreage |
Rental Revenue for the Three Months Ended March 31, 2014 |
% of Total Rental Revenue |
|||||||||||||||
| 2014(1) |
2 | 307 | 5.1 | % | $ | 115,574 | 7.7 | % | ||||||||||||
| 2015 |
1 | 72 | 1.2 | % | 35,625 | 2.4 | % | |||||||||||||
| 2016 |
1 | 59 | 1.0 | % | 17,084 | 1.1 | % | |||||||||||||
| 2017 |
1 | 124 | 2.1 | % | 68,548 | 4.6 | % | |||||||||||||
| 2018 |
2 | 370 | 6.1 | % | 63,789 | 4.3 | % | |||||||||||||
| 2019 |
0 | 0 | 0.0 | % | — | 0.0 | % | |||||||||||||
| Thereafter |
8 | 5,068 | 84.5 | % | 1,195,016 | 79.9 | % | |||||||||||||
|
|
|
|
|
|
|
|
|
|
|
|||||||||||
| Totals |
15 | 6,000 | 100.0 | % | $ | 1,495,636 | 100.0 | % | ||||||||||||
|
|
|
|
|
|
|
|
|
|
|
|||||||||||
| (1) | Includes a surface area lease on a portion of one property leased to an oil company that is renewed on a year-to-year basis. |
13
Future Lease Payments
Future operating lease payments from tenants under all non-cancelable leases, excluding tenant reimbursement of expenses, for the remainder of 2014 and each of the five succeeding fiscal years and thereafter as of March 31, 2014, are as follows:
| Period |
Tenant Lease Payments |
|||||||
| For the remaining nine months ending December 31: |
2014 | $ | 4,474,612 | |||||
| For the fiscal years ending December 31: |
2015 | 5,425,610 | ||||||
| 2016 | 5,362,569 | |||||||
| 2017 | 5,265,339 | |||||||
| 2018 | 4,935,315 | |||||||
| 2019 | 4,928,252 | |||||||
| Thereafter | 12,053,723 | |||||||
|
|
|
|||||||
| $ | 42,445,420 | |||||||
|
|
|
|||||||
In accordance with the lease terms, substantially all operating expenses are required to be paid by the tenant; however, we would be required to pay real estate property taxes on the respective parcels of land in the event the tenants fail to pay them. The aggregate annual real estate property taxes for all parcels of land owned by us as of March 31, 2014, are approximately $447,000.
Portfolio Diversification and Concentrations
Diversification
The following table summarizes the geographic locations of our properties with leases in place as of March 31, 2014 and 2013:
| As of and For the Three Months Ended March 31, 2014 | As of and For the Three Months Ended March 31, 2013 | |||||||||||||||||||||||||||||||||||||||
| State |
Number of Farms |
Total Acres |
% of Total Acres |
Rental Revenue |
% of Total Rental Revenue |
Number of Farms |
Total Acres |
% of Total Acres |
Rental Revenue |
% of Total Rental Revenue |
||||||||||||||||||||||||||||||
| California |
8 | 1,454 | 24.2 | % | $ | 1,013,612 | 67.8 | % | 6 | 1,228 | 75.3 | % | $ | 795,541 | 87.0 | % | ||||||||||||||||||||||||
| Oregon |
2 | 2,113 | 35.2 | % | 238,025 | 15.9 | % | 0 | 0 | 0.0 | % | — | 0.0 | % | ||||||||||||||||||||||||||
| Florida |
6 | 402 | 6.7 | % | 116,982 | 7.8 | % | 6 | 402 | 24.7 | % | 119,042 | 13.0 | % | ||||||||||||||||||||||||||
| Arizona |
1 | 1,761 | 29.4 | % | 72,757 | 4.9 | % | 0 | 0 | 0.0 | % | — | 0.0 | % | ||||||||||||||||||||||||||
| Michigan |
4 | 270 | 4.5 | % | 54,260 | 3.6 | % | 0 | 0 | 0.0 | % | — | 0.0 | % | ||||||||||||||||||||||||||
|
|
|
|
|
|
|
|
|
|
|
|
|
|
|
|
|
|
|
|
|
|||||||||||||||||||||
| 21 | 6,000 | 100.0 | % | $ | 1,495,636 | 100.0 | % | 12 | 1,630 | 100.0 | % | $ | 914,583 | 100.0 | % | |||||||||||||||||||||||||
|
|
|
|
|
|
|
|
|
|
|
|
|
|
|
|
|
|
|
|
|
|||||||||||||||||||||
Concentrations
Credit Risk
Two of our farms are leased to a single tenant, Dole Food Company (“Dole”). As of March 31, 2014, 960 acres were leased to Dole, representing 16.0% of the total acreage we owned. Furthermore, these farms accounted for approximately $0.7 million, or 47.2%, of the rental income recorded during the three months ended March 31, 2014. Rental income from Dole accounted for 70.8% of the total rental income recorded during the three months ended March 31, 2013. If Dole fails to make rental payments or elects to terminate any of its leases, and the land cannot be re-leased on satisfactory terms, there would be a material adverse effect on our financial performance and ability to continue operations. No other individual tenant represented greater than 20.0% of the total rental income recorded during the three months ended March 31, 2014 or 2013.
14
Geographic Risk
8 of our 21 farms owned as of March 31, 2014, are located in California. As of March 31, 2014, our farmland in California accounted for 1,454 acres, or 24.2% of the total acreage we owned. Furthermore, these farms accounted for approximately $1.0 million, or 67.8%, of the rental income recorded during the three months ended March 31, 2014. Rental income from our farms in California accounted for 87.0 % of the total rental income recorded by us during the three months ended March 31, 2013. Our other farms, located in Arizona, Florida, Michigan and Oregon, were purchased between October 2011 and December 2013. Though we seek to continue to further diversify geographically, should an unexpected natural disaster occur where our properties are located, there could be a material adverse effect on our financial performance and ability to continue operations.
NOTE 4. RELATED-PARTY TRANSACTIONS
We are externally managed pursuant to contractual arrangements with our Adviser and our Administrator, which collectively employ all of our personnel and pay their salaries, benefits and general expenses directly. We had an advisory agreement with our Adviser that was in effect through January 31, 2013 (the “Prior Advisory Agreement”), which we and our Adviser amended, effective February 1, 2013 (the “Amended Advisory Agreement”). We also had an administration agreement with our Administrator that was in effect through January 31, 2013 (the “Prior Administration Agreement”), which we and our Administrator amended, effective February 1, 2013 (the “Amended Administration Agreement”). The management and administrative services and fees under both of these agreements are described below.
Prior Advisory and Administration Agreements
Prior Advisory Agreement
We entered into the Prior Advisory Agreement with our Adviser in 2004, pursuant to which the Adviser was responsible for managing us on a day-to-day basis and for identifying, evaluating, negotiating and consummating investment transactions consistent with our criteria. In exchange for such services, we paid the Adviser a management advisory fee, which consisted of the reimbursement of certain expenses of the Adviser. We reimbursed our Adviser for our pro-rata share of our Adviser’s payroll and related benefit expenses on an employee-by-employee basis, based on the percentage of each employee’s time devoted to our matters in relation to the time such employees devoted to all affiliated funds, collectively, advised by our Adviser. We also reimbursed the Adviser for general overhead expenses multiplied by the ratio of hours worked by the Adviser’s employees on Company matters to the total hours worked by the Adviser’s employees. We compensated our Adviser through reimbursement of our portion of the Adviser’s payroll, benefits and general overhead expenses. This reimbursement was generally subject to a combined annual management advisory fee limitation of 2.0% of our average invested assets for the year, with certain exceptions. Reimbursement for overhead expenses was only required up to the point that reimbursed overhead expenses and payroll and benefits expenses, on a combined basis, equaled 2.0% of our average invested assets for the year, and general overhead expenses were required to be reimbursed only if the amount of payroll and benefits reimbursed to the Adviser was less than 2.0% of our average invested assets for the year. However, payroll and benefits expenses were required to be reimbursed by us to the extent that they exceed the overall 2.0% annual management advisory fee limitation. To the extent that overhead expenses payable or reimbursable by us exceeded this limit and our independent directors determined that the excess expenses were justified based on unusual and nonrecurring factors which they deemed sufficient, we were permitted to reimburse the Adviser in future years for the full amount of the excess expenses, or any portion thereof, but only to the extent that the reimbursement would not have caused our overhead expense reimbursements to exceed the 2.0% limitation in any one year. The management advisory fee under the Prior Advisory Agreement never exceeded the annual cap.
Prior Administration Agreement
We entered into the Prior Administration Agreement with our Administrator, effective January 1, 2010, as amended on June 1, 2011, pursuant to which we paid for our allocable portion of our Administrator’s overhead expenses in performing its obligations to us, including, but not limited to, rent and the salaries and benefits of our chief financial officer and treasurer, chief compliance officer, internal counsel and secretary and their respective staffs. We compensated our Administrator through reimbursement of our portion of the Administrator’s payroll, benefits and general overhead expenses.
15
Amended and Restated Advisory and Administration Agreements
On February 1, 2013, we entered into each of the Amended Advisory Agreement and the Amended Administration Agreement.
Amended Advisory Agreement
Base Management Fee
Under the terms of our Amended Advisory Agreement that went into effect on February 1, 2013, we pay an annual base management fee equal to a percentage of our adjusted stockholders’ equity, which is defined as our total stockholders’ equity at the end of each quarter less the recorded value of any preferred stock we may issue and, for 2013 only, any uninvested cash proceeds from the IPO. For 2013, the base management fee was set at 1.0% of our adjusted stockholders’ equity; however, beginning in 2014, the base management fee equals 2.0% of our adjusted stockholders’ equity, which no longer excludes the uninvested cash proceeds from the IPO.
Incentive Fee
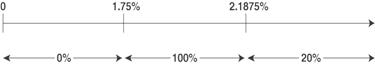
Under the terms of our Amended Advisory Agreement, we also pay an additional quarterly incentive fee based on funds from operations (“FFO”). For purposes of calculating the incentive fee, our FFO, before giving effect to any incentive fee (our “Pre-Incentive Fee FFO”) will include any realized capital gains or losses, less any distributions paid on our preferred stock, but will not include any unrealized capital gains or losses. The incentive fee will reward our Adviser if our Pre-Incentive Fee FFO for a particular calendar quarter exceeds a hurdle rate of 1.75% (7% annualized) of our total stockholders’ equity at the end of the quarter. Our Adviser will receive 100% of the amount of the Pre-Incentive Fee FFO for the quarter that exceeds the hurdle rate but is less than 2.1875% of our total stockholders’ equity at the end of the quarter (8.75% annualized), and 20% of the amount of our Pre-Incentive Fee FFO that exceeds 2.1875% for the quarter.
For the three months ended March 31, 2013, we paid an incentive fee to our Adviser of $41,037; however, during the three months ended June 30, 2013, our Adviser issued a one-time, irrevocable waiver equal to the full amount of the incentive fee paid for the three months ended March 31, 2013, and such fee was credited to us during the three months ended June 30, 2013. There was no incentive fee earned by our Adviser for the three months ended March 31, 2014, as our Pre-Incentive Fee FFO did not exceed the hurdle rate.
Amended Administration Agreement
Under the terms of the Amended Administration Agreement that went into effect on February 1, 2013, we pay separately for our allocable portion of the Administrator’s overhead expenses in performing its obligations, including rent and our allocable portion of the salaries and benefits expenses of our chief financial officer and treasurer, chief accounting officer, chief compliance officer, internal counsel and secretary and their respective staffs. Unlike the Prior Administration Agreement, which provided that our allocable portion of these expenses be based on the percentage of time that our Administrator’s personnel devoted to our affairs, under the Amended Administration Agreement, our allocable portion of these expenses is generally derived by multiplying the Administrator’s total allocable expenses by the percentage of our total assets at the beginning of each quarter in comparison to the total assets of all companies for whom our Administrator provides services.
16
The following table summarizes the management fees, incentive fees and associated credits and the administration fees reflected in our accompanying Condensed Consolidated Statements of Operations:
| For the Three Months Ended March 31, | ||||||||
| 2014 | 2013 | |||||||
| Management Fee: |
||||||||
| Allocated payroll and benefits |
$ | — | $ | 38,668 | ||||
| Allocated overhead expenses |
— | 7,538 | ||||||
|
|
|
|
|
|||||
| Prior management advisory fee(1) |
— | 46,206 | ||||||
| Amended base management fee(2) |
240,964 | 12,958 | ||||||
|
|
|
|
|
|||||
| Total management fee(3) |
$ | 240,964 | $ | 59,164 | ||||
|
|
|
|
|
|||||
| Incentive Fee: |
||||||||
| Incentive Fee(3)(4) |
$ | — | $ | 41,037 | ||||
|
|
|
|
|
|||||
| Net incentive fee |
$ | — | $ | 41,037 | ||||
|
|
|
|
|
|||||
| Administration Fee: |
||||||||
| Allocated payroll and benefits |
$ | — | $ | 14,034 | ||||
| Allocated overhead expenses |
— | 4,498 | ||||||
|
|
|
|
|
|||||
| Prior administration fee(1) |
— | 18,532 | ||||||
| Amended administration fee(2) |
66,158 | 19,800 | ||||||
|
|
|
|
|
|||||
| Total administration fee(3) |
$ | 66,158 | $ | 38,332 | ||||
|
|
|
|
|
|||||
| (1) | Pursuant to the Prior Advisory and Administration Agreements, respectively, as defined and described in further detail above, both of which were terminated on January 31, 2013. |
| (2) | Pursuant to the Amended Advisory and Administration Agreements, respectively, as defined and described in further detail above, both of which became effective on February 1, 2013. |
| (3) | Reflected as a line item on our accompanying Condensed Consolidated Statements of Operations. |
| (4) | An incentive fee of $41,037 was paid to our Adviser for the three months ended March 31, 2013; however, during the three months ended June 30, 2013, our Adviser issued a one-time, irrevocable waiver equal to the full amount of the incentive fee due and payable to the Adviser for the three months ended March 31, 2013. |
17
Related Party Fees Due
Amounts due to related parties on our accompanying Condensed Consolidated Balance Sheets were as follows:
| As of March 31, 2014 |
As of December 31, 2013 |
|||||||
| Management fee due to Adviser |
$ | 240,964 | $ | 91,823 | ||||
| Other due to Adviser(1) |
2,130 | 9,834 | ||||||
|
|
|
|
|
|||||
| Total due to Adviser |
243,094 | 101,657 | ||||||
|
|
|
|
|
|||||
| Administration fee due to Administrator |
66,158 | 59,062 | ||||||
| Other due to Administrator(1) |
619 | — | ||||||
|
|
|
|
|
|||||
| Total due to Administrator |
66,777 | 59,062 | ||||||
|
|
|
|
|
|||||
| Total due to related parties(2) |
$ | 309,871 | $ | 160,719 | ||||
|
|
|
|
|
|||||
| (1) | Other fees due to related parties primarily relate to miscellaneous general and administrative expenses paid by our Adviser or Administrator on our behalf. |
| (2) | Reflected as a line item on our accompanying Consolidated Balance Sheets. |
NOTE 5. BORROWINGS
Our borrowings as of March 31, 2014, and December 31, 2013, are summarized below:
| As of March 31, 2014 | As of December 31, 2013 | |||||||||||||||||||||||||||||||||||||
| Issuer |
Type of |
Date of Issuance |
Initial Commitment |
Maturity Date |
Principal Outstanding |
Stated Interest Rate |
Remaining Availability |
Principal Outstanding |
Stated Interest Rate |
Remaining Availability |
||||||||||||||||||||||||||||
| MetLife |
Mortgage Note Payable | 12/30/2010 | $ | 45,200,000 | 1/5/2026 | $ | 41,331,998 | 3.50 | % | $ | — | $ | 43,054,165 | 3.50 | % | $ | — | |||||||||||||||||||||
| MetLife |
Line of Credit | 5/31/2012 | 4,785,000 | 4/5/2017 | 100,000 | 3.25 | % | 4,685,000 | 100,000 | 3.25 | % | 4,685,000 | ||||||||||||||||||||||||||
|
|
|
|
|
|
|
|
|
|||||||||||||||||||||||||||||||
| Totals: | $ | 41,431,998 | $ | 4,685,000 | $ | 43,154,165 | $ | 4,685,000 | ||||||||||||||||||||||||||||||
|
|
|
|
|
|
|
|
|
|||||||||||||||||||||||||||||||
The weighted-average effective interest rate charged on all of our borrowings, excluding the impact of deferred financing costs, was 3.5% and 3.6% for the three months ended March 31, 2014 and 2013, respectively.
Mortgage Note Payable
On December 30, 2010, we executed a loan agreement with MetLife in an amount not to exceed $45.2 million, pursuant to a long-term note payable. The note currently accrues interest at a rate of 3.50% per year. The interest rate was subject to adjustment on January 5, 2014, and remained unchanged at 3.50%. The interest rate will be subject to further adjustment on January 5, 2017, and every three years thereafter to then-current market rates. The note is scheduled to mature on January 5, 2026, and we may not repay the note prior to maturity, except on one of the interest rate adjustment dates. We also incur a commitment fee of 0.20% on any undrawn amounts. As of March 31, 2014, there is no remaining balance available under the mortgage loan.
The fair value of our mortgage note payable outstanding as of March 31, 2014, was approximately $41.8 million, as compared to a carrying value of $41.3 million. The fair value of the mortgage note payable was valued using Level 3 inputs under the hierarchy established by ASC 820, “Fair Value Measurements and Disclosures,” and is calculated based on a discounted cash flow analysis, using interest rates based on management’s estimates of market interest rates on long-term debt with comparable terms.
18
Scheduled principal payments of the mortgage note payable for the remainder of 2014 and each of the five succeeding fiscal years and thereafter are as follows:
| Period |
Scheduled Principal Payments |
|||||||
| For the remaining nine months ending December 31: |
2014 | $ | — | |||||
| For the fiscal years ending December 31: |
2015 | 1,653,280 | ||||||
| 2016 | 1,587,149 | |||||||
| 2017 | 1,523,663 | |||||||
| 2018 | 1,462,716 | |||||||
| 2019 | 1,404,208 | |||||||
| Thereafter | 33,700,982 | |||||||
|
|
|
|||||||
| $ | 41,331,998 | |||||||
|
|
|
|||||||
As of March 31, 2014, the following properties have been pledged as collateral under this mortgage note payable: West Gonzales, West Beach, Dalton Lane, Keysville Road, Colding Loop, Trapnell Road, 38th Avenue and Sequoia Street.
Line of Credit
In May 2012, we obtained a $4.8 million revolving line of credit with MetLife that matures on April 5, 2017 (the “Credit Facility”). Our obligations under the Credit Facility are collateralized by a mortgage on San Andreas. The interest rate charged on the advances under the Credit Facility is equal to the three-month London Interbank Offered Rate (“LIBOR”) in effect at the beginning of each calendar quarter plus 3.00%, with a minimum annualized rate of 3.25%. We may use advances under the Credit Facility for both general corporate purposes and the acquisition of new properties.
As of both March 31, 2014, and December 31, 2013, there was $0.1 million outstanding under the Credit Facility, which is the minimum balance required, and approximately $4.7 million of availability from which we may draw. Due to the revolving nature of a line of credit, the carrying value of our Credit Facility of $0.1 million as of both March 31, 2014, and December 31, 2013, is deemed to approximate fair value.
NOTE 6. STOCKHOLDERS’ EQUITY
The following table summarizes the changes in our stockholders’ equity for the three months ended March 31, 2014:
| Common Stock | Distributions in Excess of Earnings |
Total Stockholders’ Equity |
||||||||||||||||||
| Number of Shares |
Par Value | Additional Paid-in Capital |
||||||||||||||||||
| Balance at December 31, 2013 |
6,530,264 | $ | 6,530 | $ | 51,326,262 | $ | (2,820,800 | ) | $ | 48,511,992 | ||||||||||
| Net income |
— | — | — | 20,918 | 20,918 | |||||||||||||||
| Distributions |
— | — | — | (587,724 | ) | (587,724 | ) | |||||||||||||
|
|
|
|
|
|
|
|
|
|
|
|||||||||||
| Balance at March 31, 2014 |
6,530,264 | $ | 6,530 | $ | 51,326,262 | $ | (3,387,606 | ) | $ | 47,945,186 | ||||||||||
|
|
|
|
|
|
|
|
|
|
|
|||||||||||
2013 Initial Public Offering
On January 28, 2013, we priced our initial public offering (“IPO”) of 3,333,334 shares of our common stock at a public offering price of $15.00 per share, which closed on January 31, 2013. Including the underwriters’ option to cover over-allotments, which was exercised on February 19, 2013, we issued a total of 3,780,264 shares, resulting in gross proceeds of $56.7 million and net proceeds, after deducting underwriting discounts and offering expenses borne by us, of approximately $51.3 million. As of March 31, 2014, $37.9 million of these proceeds have been invested in new property acquisitions, and an additional $1.7 million has been expended or accrued for capital improvements on existing properties. In addition, as of March 31, 2014, $10.3 million has been used to pay distributions to our stockholders, and a portion was used for other general corporate purposes. As of March 31, 2014, there were no significant uninvested proceeds remaining from our IPO.
19
Distributions
Our Board of Directors declared and paid the following monthly distributions to common stockholders during the three months ended March 31, 2014 and 2013:
| For the Three Months Ended March 31, |
Distributions per Common Share |
|||
| 2014 |
$ | 0.09 | ||
| 2013 |
0.08 | |||
A portion of the distributions paid during the three months ended March 31, 2013, related to the $9.6 million of accumulated earnings and profits from prior years we had to pay out by the end of the year for which we elect to be taxed as a REIT, as explained further below. We will provide information related to the federal income tax characterization of our 2014 distributions in an IRS Form 1099-DIV, which will be issued to our stockholders in January 2015.
Registration Statement
We filed a registration statement on Form S-3 (File No. 333-194539) with the SEC on March 13, 2014, which the SEC declared effective on April 2, 2014. The registration statement permits us to issue up to an aggregate of $300.0 million in securities, consisting of common stock, senior common stock, preferred stock, subscription rights, debt securities and warrants to purchase common stock, including through a combined offering of two or more of such securities.
REIT Election and Accumulated Earnings and Profits
We intend to elect to be taxed as a REIT for federal income tax purposes for the year ended December 31, 2013, which election will be made when we file our 2013 federal income tax return later this year. To qualify as a REIT for 2013, we were required to distribute our non-REIT accumulated earnings and profits by December 31, 2013. We believe that our non-REIT accumulated earnings and profits were approximately $9.6 million as of December 31, 2013, before taking into account any stockholder distributions during 2013. By paying out $9.7 million in distributions to stockholders during 2013, we believe that we have fully distributed all accumulated earnings and profits from prior years.
The amount of accumulated earnings and profits of $9.6 million from prior years included approximately $4.0 million of earnings and profits associated with deferred intercompany gains, described elsewhere in this Form 10-Q, that, upon our expected REIT election later this year, we will recognize effective as of December 31, 2012, for federal income tax purposes. Accordingly, the resulting federal income tax from such gain recognition will be due at the time of our expected REIT election later this year.
NOTE 7. EARNINGS PER SHARE OF COMMON STOCK
The following table sets forth the computation of basic and diluted earnings per common share for the three months ended March 31, 2014 and 2013. Earnings per share is computed using the weighted average number of shares outstanding during the respective periods.
| For the Three Months Ended March 31, | ||||||||
| 2014 | 2013 | |||||||
| Net income |
$ | 20,918 | $ | 47,516 | ||||
| Weighted average shares of common stock outstanding - basic and diluted |
6,530,264 | 5,249,898 | ||||||
|
|
|
|
|
|||||
| Basic and diluted earnings per common share |
$ | 0.00 | $ | 0.01 | ||||
|
|
|
|
|
|||||
NOTE 8. COMMITMENTS AND CONTINGENCIES
In connection with the execution of a new lease on Colding Loop in May 2013, we were required to install new wells and irrigation equipment on 121 of the 181 total farmable acres on the property. The installation of the new wells and irrigation equipment on these acres was completed in January 2014 at a total cost of $616,071. In addition, if the tenant notifies us of their intention to fully utilize the remaining 60 acres of the property, we will be required to install new irrigation equipment to cover the additional 60 acres, which is estimated to cost approximately $83,000.
20
Coinciding with the extension of the lease on West Beach, we entered into an agreement with the tenants on the farm to provide oversight on certain capital improvements that will serve to protect the property against future flooding. The cost of these improvements, which we expect to be between $200,000 and $250,000, will be borne by us and will take place over the next year. In addition, under the terms of the agreement with our tenants, we are required to pay them $46,000 for their oversight role, to be paid in two equal installments over the course of the next year. These capital improvements are currently underway, and, as of March 31, 2014, we have expended or accrued approximately $55,000 related to these improvements.
NOTE 9. SUBSEQUENT EVENTS
Distributions
On April 8, 2014, our Board of Directors declared the following monthly cash distributions to common stockholders:
| Record Date |
Payment Date | Distribution per Common Share |
||||||
| April 21, 2014 |
April 30, 2014 | $ | 0.03 | |||||
| May 20, 2014 |
May 30, 2014 | 0.03 | ||||||
| June 19, 2014 |
June 30, 2014 | 0.03 | ||||||
|
|
|
|||||||
| Total: | $ | 0.09 | ||||||
|
|
|
|||||||
21
ITEM 2. MANAGEMENT’S DISCUSSION AND ANALYSIS OF FINANCIAL CONDITION AND RESULTS OF OPERATIONS
All statements contained herein, other than historical facts, may constitute “forward-looking statements” within the meaning of Section 27A of the Securities Act of 1933, as amended, and Section 21E of the Securities Exchange Act of 1934, as amended (the “Exchange Act”). These statements may relate to, among other things, future events or our future performance or financial condition. In some cases, you can identify forward-looking statements by terminology such as “may,” “might,” “believe,” “will,” “provided,” “anticipate,” “future,” “could,” “growth,” “plan,” “intend,” “expect,” “should,” “would,” “if,” “seek,” “possible,” “potential,” “likely” or the negative of such terms or comparable terminology. These forward-looking statements involve known and unknown risks, uncertainties and other factors that may cause our business, financial condition, liquidity, results of operations, funds from operations or prospects to be materially different from any future business, financial condition, liquidity, results of operations, funds from operations or prospects expressed or implied by such forward-looking statements and include, but are not limited to:
| • | Changes in our industry, interest rates or the general economy; |
| • | Natural disasters or climactic changes impacting the regions in which our tenants operate; |
| • | The degree and nature of our competition; |
| • | Changes in our business strategy; and |
| • | Loss of our key personnel. |
For further information about these and other factors that could affect our future results, please see the captions titled “Risk Factors” in our Annual Report on Form 10-K for the year ended December 31, 2013. We caution readers not to place undue reliance on any such forward-looking statements, which are made pursuant to the Private Securities Litigation Reform Act of 1995 and, as such, speak only as of the date made. We undertake no obligation to publicly update or revise any forward-looking statements, whether as a result of new information, future events or otherwise, after the date of this Quarterly Report on Form 10-Q, except as required by law.
All references to “we,” “our,” “us” and the “Company” in this Quarterly Report mean Gladstone Land Corporation and its consolidated subsidiaries, except where it is made clear that the term refers only to Gladstone Land Corporation.
OVERVIEW
General
We are an externally-managed real estate company that currently owns 21 farms: 8 in California, 6 in Florida, 4 in Michigan, 2 in Oregon and 1 in Arizona. These farms are currently leased to 16 separate tenants that are either corporate or independent farmers. We intend to acquire more farmland in these and other states in our regions of focus that is or will be leased to farmers, and we expect that most of our future tenants will be medium-sized independent farming operations or large corporate farming operations that are unrelated to us. We may also acquire property related to farming, such as cooling facilities, freezer buildings, packing houses, box barns, silos, storage facilities, green houses, processing plants, packing buildings and distribution centers. We generally lease our properties under triple-net leases, an arrangement under which the tenant maintains the property while paying the related taxes, maintenance and insurance costs, as well as rent to us. We may also elect to sell farmland at certain times, such as when the land could be developed by others for urban or suburban uses.
To a lesser extent, we may provide senior secured first-lien mortgages to farmers for the purchase of farmland and farm-related properties. We expect that any mortgages we make would be secured by farming properties that have been in operation for over five years with a history of crop production and profitable farming operations. We have not currently identified any properties for which to make loans secured by properties.
We were incorporated in 1997, primarily for the purpose of operating strawberry farms through our former subsidiary, Coastal Berry Company, LLC (“Coastal Berry”), an entity that provided growing, packaging, marketing and distribution of fresh berries and other agricultural products. We operated Coastal Berry as our primary business until 2004, when it was sold to Dole Food Company (“Dole”).
22
Since 2004, our operations have consisted solely of leasing our farms. We also lease a small parcel on our farm near Oxnard, California (“West Gonzales”), to an oil company. We do not currently intend to enter into the business of growing, packing or marketing farmed products; however, if we do so in the future, we expect that it would be through a taxable real estate investment trust subsidiary (“TRS”).
As described further below, we have exhausted substantially all of the proceeds received from our initial public offering in January 2013 (the “IPO”) via new property acquisitions, improvements on existing properties, distributions to stockholders and other general corporate purposes. We intend to continue to lease our farm properties to corporate farmers or independent farmers that sell their products through national corporate marketers-distributors. We currently have no plans to make mortgage loans on farms, but we may make mortgage loans on farms and farm-related properties in the future. We expect to earn rental and interest income from our investments.
Gladstone Management Corporation (our “Adviser”) manages our real estate portfolio pursuant to an advisory agreement, and Gladstone Administration, LLC (our “Administrator”) provides administrative services to us pursuant to an administration agreement. Our Adviser and our Administrator collectively employ all of our personnel and pay directly their salaries, benefits and general expenses.
We conduct substantially all of our investment activities through, and all of our properties are held, directly or indirectly, by, Gladstone Land Limited Partnership (the “Operating Partnership”). We control our Operating Partnership as its sole general partner, and we also currently own, directly or indirectly, all limited partnership units (“Units”) of our Operating Partnership. We expect to offer equity ownership in our Operating Partnership by issuing Units from time to time in exchange for agricultural real property. By structuring our acquisitions in this manner, the sellers of the real estate will generally be able to defer the realization of gains until they redeem the Units or sell the Units for cash. Persons who receive Units in our Operating Partnership in exchange for real estate or interests in entities that own real estate will be entitled to redeem these Units for cash or, at our election, shares of our common stock on a one-for-one basis at any time after holding the Units for one year.
We believe that we have completed all significant actions necessary to convert into a real estate investment trust (“REIT”), effective January 1, 2013, including the distribution of all accumulated earnings and profits (“E&P”) from prior years. Therefore, beginning with our tax year ended December 31, 2013, we intend to elect to be taxed as a REIT for federal income tax purposes. We intend to make such election upon the filing of our 2013 tax return later this year. As a REIT, we generally will not be required to pay federal and state income taxes on the distributions we make to our stockholders. Any TRS through which we may conduct operations will be required to pay federal and state income taxes on its taxable income, if any, at the then-applicable corporate rates. To the extent we do not qualify or elect to be taxed as a REIT for federal income tax purposes, we will be subject to regular corporate income tax on our taxable income.
Objectives and Strategies
Our principal business objective is to maximize stockholder returns through a combination of: (1) monthly cash distributions to our stockholders; (2) sustainable long-term growth in cash flows from increased rents, which we hope to pass on to stockholders in the form of increased distributions; (3) appreciation of our land; and (4) capital gains derived from the sale of our properties. Our primary strategy to achieve our business objective is to invest in a diversified portfolio of triple-net leased farmland and properties related to farming operations.
We expect that most of our future tenants will be medium-sized independent farming operations or large corporate farming operations that are unrelated to us. We intend to lease our properties under triple-net leases, an arrangement under which the tenant maintains the property while paying the related taxes, maintenance and insurance costs, as well as rent to us. We are actively seeking and evaluating other farm properties for potential purchase. All potential acquisitions will be subject to due diligence procedures, and there can be no assurance that we will be successful in identifying or acquiring additional properties in the future.
Leases
We anticipate that most of our agricultural leases for properties growing row crops will have initial terms of two to five years, often with options to extend the lease further, and rent will be payable semi-annually to us, at a fixed rate, with one-half due at the beginning of the year and the other half due later in the year. We anticipate that most of our agricultural leases for
23
properties growing long-term plants, such as trees, bushes and vines, will have longer-term leases with similar payment terms. Leases generally will be on a triple-net basis, which means that, in addition to rent, the tenant will be required to pay taxes, insurance (including drought insurance for properties that depend upon rain water for irrigation), water costs, maintenance and other operating costs. We expect that leases with longer terms, such as for five or more years, would contain provisions, often referred to as escalation clauses, that provide for annual increases in the amounts payable by the tenants. The escalation clause may be a fixed amount each year, or it may be variable based on standard cost of living figures. In addition, some long-term leases may require a regular survey of comparable land rents, with an adjustment to reflect the current rents. We do not expect to enter into leases that include variable rent based on the success of the harvest each year. Our current leases are generally on a triple-net basis with original lease terms ranging from 1 to 15 years.
We monitor our tenants’ credit quality on an ongoing basis by, among other things, conducting site visits of the properties to ensure farming operations are taking place and to assess the general maintenance of the properties. To date, no changes to credit quality of our tenants have been identified and all tenants continue to pay pursuant to the terms of their respective leases.
Lease Expirations
Farm leases are often short-term in nature, so in any given year we expect to have multiple leases up for renewal or extension. We extended all of our agricultural leases that were due to expire in 2013 prior to their expiration and without any downtime on the properties. We have one agricultural lease expiring in 2014, on 307 acres of farmland near Watsonville, California (“San Andreas”). This lease accounted for approximately 5.1% of the total acreage owned as of March 31, 2014, and 7.2% of the rental income recorded during the three months ended March 31, 2014.
We also had one agricultural lease on 198 acres of farmland near Watsonville, California (“West Beach”), which was set to expire in 2014. However, during the three months ended March 31, 2014, we entered into a nine-year lease on the property with a new tenant at rental rates representing a 21% increase in minimum annualized GAAP straight-line rental income over that of the current lease.
We have begun discussions regarding the lease on San Andreas, and we anticipate being able to renew the lease prior to its expiration on December 31, 2014. In addition, given that the property is in the same region as the new lease we executed on West Beach, as both properties are in Watsonville, California, we expect to be able to renew the lease at a higher rental rate. However, there can be no assurance that we will be able to renew the lease at a rate favorable to us, if at all, or be able to find a replacement tenant for the lease, if necessary.
In addition, we also have a surface area lease with an oil company on 8 acres of West Gonzales that is renewed on an annual basis and continues for so long as the tenant continues to use its oil rights. This lease accounted for approximately 0.5% of the rental income recorded during the three months ended March 31, 2014.
Mortgages
We may also make loans to farmers for the purchase of farmland and other properties related to farming, not to exceed 5.0% of the fair value of our total assets, over time. These loans would be secured by mortgages on the property. In the event that we make any such loans, we expect that the typical mortgage would carry a fixed interest rate over a term of three to five years and would require interest-only payments with no amortization of the principal until maturity. We expect that the mortgage would be set up to have the senior claim on the property but would not require the owner to guarantee the mortgage personally. If we make mortgage loans, we intend to provide borrowers with a conditional put option giving them the right to sell the property to us at a predetermined fair market value, and we also may have a call option to buy the property from the borrower.
REIT Election and Accumulated Earnings and Profits
We intend to elect to be taxed as a REIT for federal income tax purposes for the year ended December 31, 2013. To qualify as a REIT for 2013, we were required to distribute our non-REIT accumulated earnings and profits by December 31, 2013. As of December 31, 2013, our non-REIT accumulated earnings and profits were approximately $9.6 million. By paying out $9.7 million in distributions to stockholders during 2013, we believe that we have fully paid out all non-REIT accumulated earnings and profits from prior years.
24
Business Environment
The United States (the “U.S.”) continues to recover from the recession that began in late 2007. Notwithstanding the U.S. government shutdown in October 2013, we are seeing improvements in the labor market, as the unemployment rate continues its downward trajectory. The housing market has also picked up, as construction starts and housing prices are, on average, rising, and foreclosure and delinquency rates are stabilized or declining. However, various signs of weakness are still present in the economy. Interest rates, despite their significant increase in the past year, remain near their historic lows, leading to increased competition for new acquisitions and causing cap rate compression, and uncertainty over rising mortgage interest rates still persists. In addition, recent U.S. budget deficit concerns and the budget impasse that resulted in the partial shutdown of the U.S. government in October 2013 had wide-ranging effects on the economy, as it slowed economic growth, damaged consumer confidence and led to uncertain conditions for many businesses. While the U.S. Congress passed legislation in Februgreary 2014 to suspend the debt ceiling through March 2015, Congress will need to pass additional legislation to increase or suspend the debt ceiling prior to March 2015 in order for the government to continue making payments to its creditors. The uncertainty surrounding these conditions could result in ratings agencies lowering the long-term sovereign credit rating of the U.S., as one of the ratings agencies did in 2011. These developments, and the government’s credit concerns in general, could cause interest rates and borrowing costs to rise, which may negatively impact our ability to access both the debt and equity markets on favorable terms. Unfavorable economic conditions and uncertainty of legislation related to agriculture could also have a material adverse effect on one or more of our tenants, as well as on our business, financial condition and results of operations.
Land values across the majority of the U.S. have seen a steady increase over the past decade. More specifically, values of U.S. farm real estate and croplands in many areas have each seen close to double-digit appreciation over the past couple of years. We believe that certain trends continue to make farmland a compelling investment. Domestic and global population growth is a major driver behind the increased demand for farmland, as more food is needed to feed the growing population. In addition, more and more agricultural land is being developed for urban, suburban and industrial purposes. While increased development and changing patterns of use may increase the land values and rents in our portfolio, it could also result in upward pressure on prices for farms that we seek to acquire.
Recent Developments
Leasing Activity
| • | Trapnell Road: On January 20, 2014 we completed the work for the expansion and upgrade of the cooling facility on Trapnell Road, for which we agreed to incur the costs, up to a maximum of $450,000. We expended a total of $446,108 in connection with this project, and, in accordance with the lease amendment executed in October 2013, we will earn additional rental income on the costs incurred related to this project at an initial annual rate of 8.5%, with prescribed rental escalations provided for in the lease. |
| • | West Beach: On March 27, 2014, we executed a lease with a new tenant to occupy West Beach with a term that commences on November 1, 2014, as the lease term with the current tenants on the property will expire on October 31, 2014. The new lease term is for nine years, through December 31, 2023, and provides for prescribed rent escalations over its life, with minimum annualized GAAP straight-line rental income of $540,469, representing a 21% increase over that of the current lease. |
Financing Activity
Our $45.2 million note agreement with Metropolitan Life Insurance Company (“MetLife”) matures on January 5, 2026, and is fully drawn, though we are currently in negotiations with MetLife to expand the commitment amount and extend the maturity. A non-binding term sheet has been agreed to by both parties, and we have paid a commitment fee related to the new facility; however, there is no guaranty that we will be able to complete this transaction on terms favorable to us, or at all.
25
Our Adviser and Administrator
Advisory and Administration Agreements
Since 2004, we have been externally managed pursuant to a contractual investment advisory arrangement with our Adviser, under which our Adviser has directly employed certain of our personnel and paid their payroll, benefits and general expenses directly. Prior to January 1, 2010, the advisory agreement also covered the administrative services we received from our Administrator, which, until January 1, 2010, was a wholly-owned subsidiary of our Adviser. Since January 1, 2010, our Administrator has provided administrative services to us pursuant to a separate administration agreement with our Administrator. Upon the closing of our IPO, on January 31, 2013, we entered into amended and restated versions of each of the advisory and administration agreements.
Prior Advisory and Administration Agreements
Prior Advisory Agreement
Under our advisory agreement in effect until January 31, 2013 (the “Prior Advisory Agreement”), we were required to reimburse our Adviser for our pro-rata share of our Adviser’s payroll and benefits expenses on an employee-by-employee basis, based on the percentage of each employee’s time devoted to our matters in relation to the time such employees devoted to all of our affiliated funds advised by the Adviser.
Under our Prior Advisory Agreement, we were also required to reimburse our Adviser for our pro-rata portion of all other expenses of our Adviser not reimbursed under the arrangements described above, which we refer to as overhead expenses, equal to the total overhead expenses of our Adviser multiplied by the ratio of hours worked by our Adviser’s (and until January 1, 2010, our Administrator’s) employees on our projects to the total hours worked by our Adviser’s (and until January 1, 2010, our Administrator’s) employees. However, we were only required to reimburse our Adviser for our portion of its overhead expenses if the amount of payroll and benefits we reimbursed to our Adviser was less than 2.0% of our average invested assets for the year. Additionally, we were only required to reimburse our Adviser for overhead expenses up to the point that reimbursed overhead expenses and payroll and benefits expenses, on a combined basis, equaled 2.0% of our average invested assets for the year. Our Adviser was required to reimburse us annually for the amount by which amounts billed to and paid by us exceed this 2.0% limit during a given year. These amounts never exceeded the 2.0% limit, and, therefore, we never received or qualified for any such reimbursement.
Prior Administration Agreement
Under our administration agreement in effect until January 31, 2013 (the “Prior Administration Agreement”), we were required to reimburse our Administrator for our pro-rata portion of its payroll and benefits expenses on an employee-by-employee basis, based on the percentage of each employee’s time devoted to our matters. We were also required to reimburse our Administrator for our pro-rata portion of its overhead expenses, equal to the total overhead expenses of our Administrator multiplied by the ratio of hours worked by our Administrator’s employees on our projects to the total hours worked by our Administrator’s employees.
Amended and Restated Advisory and Administration Agreements
Amended Advisory Agreement
Under the terms of our amended and restated advisory agreement that went into effect on February 1, 2013 (the “Amended Advisory Agreement”), we pay an annual base management fee equal to a percentage of our adjusted stockholders’ equity, which is defined as our total stockholders’ equity at the end of each quarter less the recorded value of any preferred stock we may issue and, for 2013 only, any uninvested cash proceeds from the IPO. For 2013, the base management fee was set at 1.0% of our adjusted stockholders’ equity; however, in 2014, we will pay a base management fee equal to 2.0% of our adjusted stockholders’ equity, which will no longer exclude the uninvested cash proceeds from the IPO.
Under the terms of our Amended Advisory Agreement, we also pay an additional quarterly incentive fee based on our funds from operations (“FFO”). For purposes of calculating the incentive fee, our FFO before giving effect to any incentive fee (our “Pre-Incentive Fee FFO”) will include any realized capital gains or losses, less any distributions paid on any preferred
26
stock we may issue, but will not include any unrealized capital gains or losses. The incentive fee will reward our Adviser if our Pre-Incentive Fee FFO for a particular calendar quarter exceeds a hurdle rate of 1.75%, or 7% annualized, of our total stockholders’ equity at the end of the quarter. We pay our Adviser an incentive fee with respect to our Pre-Incentive Fee FFO quarterly, as follows:
| • | no incentive fee in any calendar quarter in which our pre-incentive fee FFO does not exceed the hurdle rate of 1.75% (7% annualized); |
| • | 100% of the amount of the pre-incentive fee FFO that exceeds the hurdle rate, but is less than 2.1875% in any calendar quarter (8.75% annualized); and |
| • | 20% of the amount of our pre-incentive fee FFO that exceeds 2.1875% in any calendar quarter (8.75% annualized). |
Quarterly Incentive Fee Based on FFO
Pre-Incentive Fee FFO
(expressed as a percentage of total stockholders’ equity)
Percentage of pre-incentive fee FFO allocated to the incentive fee
Amended Administration Agreement
Under the terms of the amended and restated administration agreement that went into effect on February 1, 2013 (the “Amended Administration Agreement”), we pay separately for our allocable portion of the Administrator’s overhead expenses in performing its obligations, including rent and our allocable portion of the salaries and benefits expenses of our chief financial officer and treasurer, chief accounting officer, chief compliance officer, internal counsel and secretary, and their respective staffs. Unlike our Prior Administration Agreement, which provided that our allocable portion of these expenses be based on the percentage of time that our Administrator’s personnel devoted to our affairs, under the Amended Administration Agreement, our allocable portion of these expenses is generally derived by multiplying the Administrator’s total allocable expenses by the percentage of our total assets at the beginning of each quarter in comparison to the total assets of all funds for whom our Administrator provides services.
Emerging Growth Company
We are an “emerging growth company,” as defined in the Jumpstart Our Business Startups Act (the “JOBS Act”), and we may take advantage of certain exemptions from various reporting requirements that are applicable to other public companies that are not emerging growth companies. In particular, Section 107 of the JOBS Act provides that an emerging growth company may choose to take advantage of the extended transition period provided in Section 7(a)(2)(B) of the Securities Act of 1933, as amended, for complying with new or revised accounting standards, meaning that the company can delay the adoption of certain accounting standards until those standards would otherwise apply to private companies. Additionally, we are eligible to take advantage of certain other exemptions from various reporting requirements that are applicable to public companies that are not emerging growth companies, including, but not limited to, an exemption from the auditor attestation requirements of Section 404 of the Sarbanes-Oxley Act of 2002. We have elected to take advantage of this extended transition period, and, as a result, we will comply with new or revised accounting standards on the dates on which adoption of such standards is required for private companies for as long as we maintain our emerging company status. Accordingly, the accounting standards that we apply while we remain an emerging growth company may differ materially from the accounting standards applied by other similar public companies, including emerging growth companies that have not elected to opt into this extended transition period. This election could have a material impact on our financial statements and the comparability of our financial statements to the financial statements of similar public companies.
27
Critical Accounting Policies
The preparation of our financial statements in accordance with generally accepted accounting principles in the U.S. (“GAAP”) requires management to make judgments that are subjective in nature to make certain estimates and assumptions. Application of these accounting policies involves the exercise of judgment regarding the use of assumptions as to future uncertainties, and, as a result, actual results could materially differ from these estimates. A summary of all of our significant accounting policies is provided in Note 2, “Summary of Significant Accounting Policies,” in the notes to our Condensed Consolidated Financial Statements located elsewhere in this Form 10-Q, and a summary of these critical accounting policies is below. We consider these policies critical because they involve estimates and assumptions that require complex, subjective or significant judgments in their application and that materially affect our results of operations.
Purchase Price Allocation
When we acquire real estate, we allocate the purchase price to: (i) the tangible assets acquired and liabilities assumed, consisting of land, buildings, tenant improvements, horticulture and long-term debt, and (ii) if the acquisition is a business combination, the identified intangible assets and liabilities, consisting of the value of above-market and below-market leases, in-place leases, unamortized lease origination costs, tenant relationships and capital lease obligations, based, in each case, on their fair values.
Certain of our acquisitions involve sale-leaseback transactions with newly-originated leases, which we account for as asset acquisitions under Accounting Standards Codification (“ASC”) 360, “Property, Plant and Equipment.” Other of our acquisitions involve the acquisition of farmland that is already being operated as rental property and has a lease in place that we assume at the time of acquisition, which we will generally consider to be a business combination under ASC 805, “Business Combinations.” In the case of an asset acquisition, we will capitalize the transaction costs incurred in connection with the acquisition, whereas in the case of a business combination, we will expense these transaction costs as incurred. When we account for an acquisition as a business combination, we may also record above-market and below-market in-place lease values for owned properties based on the present value (using a discount rate which reflects the risks associated with the leases acquired) of the difference between the contractual amounts to be paid pursuant to the in-place leases and management’s estimate of fair market lease rates for the corresponding in-place leases, measured over a period equal to the remaining non-cancelable term of the lease. If present, we will amortize the capitalized above-market lease values as a reduction of rental income over the remaining, non-cancelable terms of the respective leases, and we will amortize the capitalized below-market lease values, included in Other liabilities on the accompanying Condensed Consolidated Balance Sheets, as an increase to rental income over the remaining, non-cancelable terms of the respective leases. Since our strategy will, to a large degree, involve sale-leaseback transactions with newly-originated leases at market rates, we do not expect that the above-market and below-market in-place lease values will be significant for many of the transactions we will ultimately enter into.
We will measure the aggregate value of other intangible assets acquired based on the difference between the property valued with existing in-place leases adjusted to market rental rates and the property valued as if vacant. Our Adviser will estimate values using methods similar to those used by independent appraisers, such as a sales comparison approach, a cost approach, and an income capitalization approach (utilizing a discounted cash flow analysis). Factors to be considered by management in its analysis will include an estimate of carrying costs during hypothetical, expected lease-up periods, considering current market conditions and costs to execute similar leases. Our Adviser will also consider information obtained about each property as a result of our pre-acquisition due diligence, marketing and leasing activities in estimating the fair value of the tangible and intangible assets acquired. In estimating carrying costs, management will also include real estate taxes, insurance and other operating expenses and estimates of lost rental income at market rates during the hypothetical, expected lease-up periods, which we expect will primarily range from 3 to 12 months, depending on specific local market conditions.
Our Adviser will also estimate costs to execute similar leases, including leasing commissions, legal and other related expenses, to the extent such costs are not already incurred in connection with a new lease origination as part of the transaction.
The total amount of other intangible assets acquired will be further allocated to in-place lease values and customer relationship intangible values based on our Adviser’s evaluation of the specific characteristics of each tenant’s lease and our overall relationship with that respective tenant. Characteristics to be considered by our Adviser in allocating these values include the nature and extent of our existing business relationship with the tenant, prospects for developing additional
28
business with the tenant, the tenant’s credit quality and management’s expectations of lease renewals, including those existing under the terms of the current lease agreement, among other factors. We will amortize the value of in-place leases to expense over the initial term of the respective leases, which we primarily expect to range from two to five years for properties growing row crops, with longer terms for properties growing long-term plants such as trees, bushes and vines. The value of customer relationship intangibles will be amortized to expense over the initial term and any renewal periods in the respective leases. Should a tenant terminate its lease, the unamortized portion of the in-place lease value and customer relationship intangibles would be charged to expense.
29
Results of Operations
A comparison of our operating results for the three months ended March 31, 2014 and 2013 is below:
| For the Three Months Ended March 31, | ||||||||||||||||
| 2014 | 2013 | $ Change | % Change | |||||||||||||
| Operating revenues: |
||||||||||||||||
| Rental revenues |
$ | 1,495,636 | $ | 914,583 | $ | 581,053 | 63.5 | % | ||||||||
|
|
|
|
|
|
|
|
|
|||||||||
| Total operating revenues |
1,495,636 | 914,583 | 581,053 | 63.5 | % | |||||||||||
|
|
|
|
|
|
|
|
|
|||||||||
| Operating expenses: |
||||||||||||||||
| Depreciation and amortization |
288,031 | 160,036 | 127,995 | 80.0 | % | |||||||||||
| Management fee |
240,964 | 59,164 | 181,800 | 307.3 | % | |||||||||||
| Incentive fee |
— | 41,037 | (41,037 | ) | NA | |||||||||||
| Administration fee |
66,158 | 38,332 | 27,826 | 72.6 | % | |||||||||||
| Professional fees |
178,987 | 85,392 | 93,595 | 109.6 | % | |||||||||||
| Acquisition-related expenses |
43,412 | 16,871 | 26,541 | 157.3 | % | |||||||||||
| Property operating expense |
65,585 | 18,495 | 47,090 | 254.6 | % | |||||||||||
| General and administrative |
217,315 | 118,778 | 98,537 | 83.0 | % | |||||||||||
|
|
|
|
|
|
|
|
|
|||||||||
| Total operating expenses |
1,100,452 | 538,105 | 562,347 | 104.5 | % | |||||||||||
|
|
|
|
|
|
|
|
|
|||||||||
| Operating income |
395,184 | 376,478 | 18,706 | 5.0 | % | |||||||||||
|
|
|
|
|
|
|
|
|
|||||||||
| Other income (expense) |
||||||||||||||||
| Interest and other income |
6,397 | 10,627 | (4,230 | ) | -39.8 | % | ||||||||||
| Interest expense |
(374,040 | ) | (280,400 | ) | (93,640 | ) | -33.4 | % | ||||||||
|
|
|
|
|
|
|
|
|
|||||||||
| Total other expense |
(367,643 | ) | (269,773 | ) | (97,870 | ) | -36.3 | % | ||||||||
|
|
|
|
|
|
|
|
|
|||||||||
| Net income before income taxes |
27,541 | 106,705 | (79,164 | ) | -74.2 | % | ||||||||||
|
|
|
|
|
|
|
|
|
|||||||||
| Income tax provision |
(6,623 | ) | (59,189 | ) | 52,566 | 88.8 | % | |||||||||
|
|
|
|
|
|
|
|
|
|||||||||
| Net income |
$ | 20,918 | $ | 47,516 | $ | (26,598 | ) | -56.0 | % | |||||||
|
|
|
|
|
|
|
|
|
|||||||||
|
NA = Not Applicable |
||||||||||||||||
Operating Revenues
Rental revenues increased for the three months ended March 31, 2014, as compared to the prior-year period, primarily as a result of the rental income attributable to nine additional farms acquired since March 31, 2013. For the three months ended March 31, 2014, we recorded approximately $518,000 of additional rental income as a result of farms acquired since March 31, 2013, and $63,000 of additional rental income on farms held as of March 31, 2013, primarily as a result of renewing existing leases at higher rates and earning additional revenue on capital improvements constructed on certain properties.
Operating Expenses
Depreciation and amortization expenses increased for the three months ended March 31, 2014, as compared to the prior-year period, as a result of the additional farms acquired, as mentioned above, and additional site improvements made on existing properties since March 31, 2013. For the three months ended March 31, 2014, we recorded approximately $125,000 of additional depreciation and amortization expense as a result of the nine farms acquired since March 31, 2013, and $3,000 of additional depreciation and amortization expense on farms held as of March 31, 2013, primarily as a result of capital improvements made on those properties.
30
The management fee increased for the three months ended March 31, 2014, as compared to the prior-year period, primarily as a result of change in the calculation for 2014, as stipulated in the Amended Advisory Agreement. Per the agreement, for 2013, the base management fee was set at 1.0% of our adjusted stockholders’ equity, which was reduced by any uninvested cash proceeds from the IPO. In 2014, the base management fee is calculated at 2.0% of our adjusted stockholders’ equity, inclusive of any uninvested cash proceeds from the IPO.
For the month of January 2013, the management fee consisted of the reimbursement of expenses, including direct allocation of employee salaries and benefits, as well as general overhead expense, to our Adviser in accordance with the terms of the Prior Advisory Agreement. Beginning February 1, 2013, the management fee was calculated pursuant to the terms of the Amended Advisory Agreement. For the three months ended March 31, 2013, our management advisory fee under the Prior Advisory Agreement, which was terminated on January 31, 2013, was $46,206, while the base management fee under the Amended Advisory Agreement, which became effective on February 1, 2013, was $12,958. The calculation of the management fees is described in further detail above, under “Our Adviser and Administrator.”
For the three months ended March 31, 2013, we paid an incentive fee to our Adviser of $41,037; however, during the three months ended June 30, 2013, due to a change in methodology, our Adviser issued a one-time, irrevocable waiver equal to the full amount of the incentive fee paid for the three months ended March 31, 2013, and such fee was credited to us during the three months ended June 30, 2013. There was no incentive fee earned by our Adviser for the three months ended March 31, 2014, as our FFO did not exceed the hurdle rate. The calculation of the incentive fee is described in further detail above, under “Our Adviser and Administrator.”
The administration fee increased for the three months ended March 31, 2014, as compared to the prior-year period, primarily due to an increase in the ratio of our total assets in relation to the total assets of other affiliated funds managed by our Adviser, which is the basis of allocation under the Amended Administration Agreement.
For the month of January 2013, the administration fee consisted of the reimbursement of expenses, including direct allocation of employee salaries and benefits, as well as general overhead expense, to our Administrator in accordance with the terms of the Prior Administration Agreement. Beginning February 1, 2013, the administration fee was calculated pursuant to the terms of the Amended Administration Agreement. For the three months ended March 31, 2013, our administration fee under the Prior Administration Agreement, which was terminated on January 31, 2013, was $18,532, while the administration fee under the Amended Administration Agreement, which became effective on February 1, 2013, was $19,800. The administration fee is described in further detail above, under “Our Adviser and Administrator.”
Professional fees, consisting primarily of legal and accounting fees, increased for the three months ended March 31, 2014, as compared to the prior-year period, primarily as a result of audit fees incurred for additional work performed related to our REIT conversion, as well as for the valuation of properties we acquired during the fourth quarter of 2013.
Acquisition-related expenses generally consist of legal fees and fees incurred for third-party reports prepared in connection with potential acquisitions and the related due diligence analyses. Acquisition-related expenses increased for the three months ended March 31, 2014, as compared to the prior-year period, primarily as a result of a larger pipeline of investments, in part because we curtailed our acquisition activity leading up to our IPO in January 2013 to focus on completing the IPO process.
Property operating expenses consist primarily of real estate taxes, franchise taxes, insurance expense and other overhead expenses paid for certain of our properties. Property operating expenses increased for the three months ended March 31, 2014, as compared to the prior-year period, primarily due to additional filing fees and taxes incurred related to properties acquired during the last 12 months, as well as maintenance performed on wells on one of our properties.
General and administrative expenses increased for the three months ended March 31, 2014, as compared to the prior-year period, primarily due to increases in stockholder-related expenses and overhead insurance premiums due to our being a public company for a full quarter in the current-year period.
Other Income (Expense)
Interest and other income decreased for the three months ended March 31, 2014, as compared to the prior-year period, primarily due to the interest earned on the net proceeds from our IPO during 2013, a portion of which was invested in short-term U.S. Treasuries during the three months ended March 31, 2013. These U.S. Treasuries matured on June 27, 2013.
31
Interest expense increased for the three months ended March 31, 2014, as compared to the prior-year period, primarily due to increased borrowings under our mortgage note payable with MetLife. The weighted-average balance of our aggregate borrowings for the three months ended March 31, 2014, was $41.5 million, as compared to $30.2 million for the prior-year period. The overall effective interest rate charged on our aggregate borrowings, excluding the impact of deferred financing costs, was 3.53% for the three months ended March 31, 2014, as compared to 3.62% for the prior-year period.
Income Tax Provision
Net income before income taxes decreased for the three months ended March 31, 2014, as compared to the prior-year period, as a result of the reasons discussed above. In addition, both our income tax provision and our effective tax rate decreased for the three months ended March 31, 2014, when compared to the prior-year period. During 2013, we believe that we completed all significant actions necessary to qualify as and convert to a REIT, to be effective for the tax year ended December 31, 2013, and we have been organized and have been operating in such a manner as to qualify for taxation as a REIT. As such, the impact of this conversion has been reflected in the accompanying Condensed Consolidated Financial Statements as of March 31, 2014, and December 31, 2013, and for the three months ended March 31, 2014. This impact included recognizing $2.1 million of income taxes on a deferred intercompany gain related to land transfers in prior years that will be triggered and become due upon our REIT conversion. Partially offsetting this amount was the reversal of $743,676 of deferred tax liabilities and the recognition of this amount against the income tax provision as a benefit of REIT conversion. In addition, while we were able to reverse the portion of our income tax provision that related to federal income taxes, as well as certain state taxes, certain other state tax amounts are still owed and will continue to be owed through 2014, primarily to California, as a result of the deferred intercompany gain mentioned above. For additional information, refer to Note 2, “Summary of Significant Accounting Policies––Income Taxes.
32
LIQUIDITY AND CAPITAL RESOURCES
Overview and Future Capital Needs
As of March 31, 2014, we have invested $37.9 million of the $51.3 million of net proceeds received in connection with our IPO in January 2013 into new property acquisitions, and an additional $1.7 million has been expended or accrued for capital improvements on existing properties. We also used a significant portion of the proceeds to pay distributions to our stockholders, as well as for other general corporate purposes. As of March 31, 2014, all of the net proceeds from our IPO have been expended, and our available liquidity was approximately $18.2 million, comprised of $13.5 million in cash and $4.7 million of availability under our line of credit.
We intend to use our available liquidity to purchase additional farms and farm-related properties, as well for other general corporate purposes. We are actively seeking and evaluating acquisitions of additional farm properties that satisfy our investment criteria, and our pipeline of potential acquisitions remains healthy. We currently have four properties that are under either a signed letter of intent or a signed purchase and sale agreement for an aggregate amount of approximately $14.7 million, and we also have many other properties that are in various stages of our due diligence process. However, all potential acquisitions will be subject to our due diligence investigation of such properties, and there can be no assurance that we will be successful in identifying or acquiring any properties in the future.
Our current sources of funds are primarily operating cash flows and borrowings, including availability under our current line of credit that matures in April 2017. We believe that these cash resources will be sufficient to fund our distributions to stockholders, pay the debt service cost on our existing long-term mortgage and line of credit and fund our current operating costs in the near term. We further believe that our cash flows from operations, coupled with the financing capital available to us under our line of credit, are sufficient to fund our long-term liquidity needs.
However, commensurate with our desire to grow our portfolio, we are currently exploring other options available to provide us with additional capital, including ongoing negotiations with MetLife to increase their overall commitment to us, the initial terms for which have been agreed on by both parties. In addition, we have the ability to raise up to $300.0 million of additional equity capital through the sale and issuance of securities that are registered under our registration statement on Form S-3 (File No. 333-194539) in one or more future offerings. However, there is no guaranty that we will be able to obtain additional capital financing on terms favorable to us, if at all.
The following table summarizes total cash flows for operating, investing and financing activities for the three months ended March 31, 2014 and 2013:
| For the Three Months Ended March 31, |
||||||||||||||||
| 2014 | 2013 | Change ($) | Change (%) | |||||||||||||
| Net cash provided by (used in) operating activities |
$ | 393,759 | $ | (2,561,568 | ) | $ | 2,955,327 | 115.4 | % | |||||||
| Net cash used in investing activities |
(504,039 | ) | (20,046,767 | ) | 19,542,728 | 97.5 | % | |||||||||
| Net cash (used in) provided by financing activities |
(2,614,531 | ) | 50,809,696 | (53,424,227 | ) | -105.1 | % | |||||||||
|
|
|
|
|
|
|
|
|
|||||||||
| Change in Cash and Cash Equivalents |
$ | (2,724,811 | ) | $ | 28,201,361 | $ | (30,926,172 | ) | -109.7 | % | ||||||
|
|
|
|
|
|
|
|
|
|||||||||
NM = Not Meaningful
Operating Activities
The majority of cash from operating activities is generated from the rental payments we receive from our tenants, which is utilized to fund our property-level operating expenses, with any excess cash being primarily used for debt and interest payments on our mortgage note payable, management fees to our Adviser, administrative fees to our Administrator and other corporate-level expenses. The increase in cash provided by operating activities during the three months ended March 31, 2014, as compared to the prior-year period, was primarily a result of a $2.1 million tax prepayment that was paid to the Internal Revenue Service in the form of a cash bond during 2013 in anticipation of taxes we will owe in connection with the recognition of a deferred gain on land transfers from prior years that will become due upon our election to be taxed as a REIT.
33
Investing Activities
The decrease in cash used in investing activities during the three months ended March 31, 2014, as compared to the prior-year period, was primarily due to the purchase of $20.0 million in U.S. Treasuries during the prior-year period. These treasuries matured on June 27, 2013.
Financing Activities
The difference in cash used in financing activities during the three months ended March 31, 2014, as compared to cash provided by financing activities in the prior-year period, was primarily due to the net proceeds we received in the prior-year period from our IPO in January 2013.
Borrowings
Mortgage Note Payable
On December 30, 2010, we executed a loan agreement with MetLife in an amount not to exceed $45.2 million, pursuant to a long-term note payable. The note currently accrues interest at a rate of 3.50% per year. The interest rate was subject to adjustment on January 5, 2014, and remained fixed at 3.50%. The interest rate will be subject to further adjustment on January 5, 2017, and every three years thereafter to then-current market rates. The note is scheduled to mature on January 5, 2026, and we may not repay the note prior to maturity, except on one of the interest rate adjustment dates. In December 2013, we drew $13.6 million, which was the remaining balance available under the note, at an interest rate of 3.50%, which was based on the prevailing market rate at the time of the disbursement. As of March 31, 2014, this note was fully drawn, with $41.3 million outstanding.
Line of Credit
In May 2012, we obtained a $4.8 million revolving line of credit with MetLife that matures on April 5, 2017 (the “Credit Facility”). Our obligations under the Credit Facility are secured by a mortgage on San Andreas. The interest rate charged on the advances under the Credit Facility is equal to the three-month London Interbank Offered Rate (“LIBOR”) in effect at the beginning of each calendar quarter plus 3.00%, with a minimum annualized rate of 3.25%. We may use advances under the Credit Facility for both general corporate purposes and the acquisition of new properties. As of March 31, 2014, there was $0.1 million outstanding under the Credit Facility, which is the minimum balance required under the facility.
We are currently in discussions with MetLife to extend and increase the commitment amounts under both the mortgage note payable and the Credit Facility. A non-binding term sheet has been agreed to by both parties, and we have paid a commitment fee related to the new facility; however, there is no guaranty that we will be able to accomplish this on terms favorable to us, or at all.
34
Contractual Obligations and Off-Balance Sheet Arrangements
Contractual Obligations
The following table presents a summary of our material contractual obligations as of March 31, 2014:
| Payments Due During the Fiscal Years Ending December 31, | ||||||||||||||||||||
| Contractual Obligations |
Total | 2014(1) | 2015 – 2016 | 2017 – 2018 | 2019+ | |||||||||||||||
| Debt obligations(2) |
$ | 41,431,998 | $ | — | $ | 3,240,429 | $ | 3,086,379 | $ | 35,105,190 | ||||||||||
| Interest on debt obligations(3) |
14,055,172 | 734,532 | 2,808,592 | 2,568,301 | 7,943,747 | |||||||||||||||
| Purchase obligations(4) |
215,506 | 215,506 | — | — | — | |||||||||||||||
|
|
|
|
|
|
|
|
|
|
|
|||||||||||
| Total |
$ | 55,702,676 | $ | 950,038 | $ | 6,049,021 | $ | 5,654,680 | $ | 43,048,937 | ||||||||||
|
|
|
|
|
|
|
|
|
|
|
|||||||||||
| (1) | For the remaining nine months ending December 31, 2014. |
| (2) | Debt obligations represent borrowings under our mortgage note payable and line of credit that were outstanding as of March 31, 2014. The line of credit matures in April 2017, and the mortgage note payable matures in January 2026. |
| (3) | Interest on debt obligations includes estimated interest on our borrowings under our line of credit. The balance and interest rate on our line of credit are variable, thus the amount of interest calculated for purposes of this table was based upon the balance and interest rate as of March 31, 2014. |
| (4) | Purchase obligations represent commitments outstanding as of March 31, 2014, related to tenant improvements on one of our properties. |
Off-Balance Sheet Arrangements
We did not have any off-balance sheet arrangements as of March 31, 2014.
NON-GAAP FINANCIAL MEASURES
Funds from Operations and Pre-Tax Funds from Operations
The National Association of Real Estate Investment Trusts (“NAREIT”) developed FFO as a relative non-GAAP supplemental measure of operating performance of an equity REIT to recognize that income-producing real estate historically has not depreciated on the same basis determined under GAAP. FFO, as defined by NAREIT, is net income (computed in accordance with GAAP), excluding gains or losses from sales of property and impairment losses on property, plus depreciation and amortization of real estate assets, and after adjustments for unconsolidated partnerships and joint ventures. We define pre-tax funds from operations (“Pre-tax FFO”) as FFO plus the provision for income taxes. We expect to operate as a REIT, retroactively, beginning with our taxable year ended December 31, 2013. As a REIT, we generally will not be subject to federal income taxes on amounts distributed to our stockholders, provided we meet certain conditions. As such, we believe it is beneficial for investors to view our results of operations excluding the impact of income taxes.
FFO and Pre-tax FFO do not represent cash flows from operating activities in accordance with GAAP, which, unlike FFO and Pre-tax FFO, generally reflects all cash effects of transactions and other events in the determination of net income, and should not be considered an alternative to net income as an indication of our performance or to cash flows from operations as a measure of liquidity or ability to make distributions. Comparisons of FFO and Pre-tax FFO, using the NAREIT definition for FFO and the definition above for Pre-tax FFO, to similarly-titled measures for other REITs may not necessarily be meaningful due to possible differences in the definitions used by such REITs.
Pre-tax FFO available to common stockholders is Pre-tax FFO, adjusted to subtract distributions made to holders of preferred and senior common stock. We believe that net income available to common stockholders is the most directly comparable GAAP measure to Pre-tax FFO available to common stockholders.
35
Basic pre-tax funds from operations (“Basic Pre-tax FFO”) per share and diluted pre-tax funds from operations (“Diluted Pre-tax FFO”) per share are Pre-tax FFO available to common stockholders divided by the number of weighted average shares of common stock outstanding and Pre-tax FFO available to common stockholders divided by the number of weighted average shares of common stock outstanding on a diluted basis, respectively, during a period. We believe that Pre-tax FFO available to common stockholders, Basic Pre-tax FFO per share and Diluted Pre-tax FFO per share are useful to investors because they provide investors with a further context for evaluating our Pre-tax FFO results in the same manner that investors use net income and earnings per share (“EPS”) in evaluating net income available to common stockholders. In addition, because most REITs provide FFO available to common stockholders, Basic FFO and Diluted FFO per share information to the investment community, we believe these are useful supplemental measures when comparing us to REITs. We believe that net income is the most directly comparable GAAP measure to FFO and Pre-tax FFO, Basic EPS is the most directly comparable GAAP measure to Basic Pre-tax FFO per share, and diluted EPS is the most directly comparable GAAP measure to Diluted Pre-tax FFO per share.
The following table provides a reconciliation of our FFO and Pre-tax FFO for the three months ended March 31, 2014 and 2013 to the most directly comparable GAAP measure, net income, and a computation of basic and diluted Pre-tax FFO per weighted average share of common stock:
| For the Three Months Ended March 31, | ||||||||
| 2014 | 2013 | |||||||
| Net income |
$ | 20,918 | $ | 47,516 | ||||
| Add: Real estate and intangible depreciation and amortization |
288,031 | 160,036 | ||||||
|
|
|
|
|
|||||
| FFO |
308,949 | 207,552 | ||||||
| Add: Income tax provision |
6,623 | 59,189 | ||||||
|
|
|
|
|
|||||
| Pre-tax FFO available to common stockholders |
$ | 315,572 | $ | 266,741 | ||||
|
|
|
|
|
|||||
| Weighted average common shares outstanding—basic & diluted |
6,530,264 | 5,249,898 | ||||||
|
|
|
|
|
|||||
| Pre-tax FFO per weighted average common share—basic and diluted |
$ | 0.05 | $ | 0.05 | ||||
|
|
|
|
|
|||||
Net Asset Value
The following table provides certain summary information about our 21 farm properties as of March 31, 2014.
| Property Name |
Location | Date Acquired |
Number of Farms |
Total Acres |
Farmable Acres |
Net Cost Basis(1) |
Prior Fair Value(2) |
Current Fair Value |
||||||||||||||||||||||||
| San Andreas |
Watsonville, CA | 6/16/1997 | 1 | 307 | 237 | $ | 4,855,100 | $ | 10,700,000 | (3) | $ | 10,700,000 | (3) | |||||||||||||||||||
| West Gonzales |
Oxnard, CA | 9/15/1998 | 1 | 653 | 502 | 12,339,049 | 45,800,000 | (3) | 49,900,000 | (5) | ||||||||||||||||||||||
| West Beach |
Watsonville, CA | 1/3/2011 | 3 | 196 | 195 | 8,383,970 | 9,150,000 | (3) | 9,150,000 | (3) | ||||||||||||||||||||||
| Dalton Lane |
Watsonville, CA | 7/7/2011 | 1 | 72 | 70 | 2,718,326 | 2,800,000 | (3) | 2,800,000 | (3) | ||||||||||||||||||||||
| Keysville Road |
Plant City, FL | 10/26/2011 | 2 | 59 | 50 | 1,230,758 | 1,496,000 | (3) | 1,496,000 | (3) | ||||||||||||||||||||||
| Colding Loop |
Wimauma, FL | 8/9/2012 | 1 | 219 | 181 | 3,980,623 | 4,300,000 | (3) | 4,300,000 | (3) | ||||||||||||||||||||||
| Trapnell Road |
Plant City, FL | 9/12/2012 | 3 | 124 | 110 | 4,227,983 | 4,425,000 | (3) | 4,425,000 | (3) | ||||||||||||||||||||||
| 38th Avenue |
Covert, MI | 4/5/2013 | 1 | 119 | 89 | 1,343,135 | 1,341,000 | (4) | 1,341,000 | (4) | ||||||||||||||||||||||
| Sequoia Street |
Brooks, OR | 5/31/2013 | 1 | 218 | 206 | 3,176,000 | 3,100,000 | (4) | 3,100,000 | (4) | ||||||||||||||||||||||
| Natividad Road |
Salinas, CA | 10/21/2013 | 1 | 166 | 166 | 7,456,086 | 7,325,000 | (4) | 7,325,120 | (4) | ||||||||||||||||||||||
| 20th Avenue |
South Haven, MI | 11/5/2013 | 3 | 151 | 94 | 1,994,669 | 1,985,000 | (4) | 1,985,000 | (4) | ||||||||||||||||||||||
| Broadway Road |
Moorpark, CA | 12/16/2013 | 1 | 60 | 60 | 3,001,717 | 3,000,000 | (4) | 3,000,000 | (4) | ||||||||||||||||||||||
| Oregon Trail |
Echo, OR | 12/27/2013 | 1 | 1,895 | 1,640 | 14,049,596 | 13,855,000 | (4) | 13,855,000 | (4) | ||||||||||||||||||||||
| East Shelton |
Willcox, AZ | 12/27/2013 | 1 | 1,761 | 1,320 | 7,222,449 | 6,700,000 | (4) | 6,700,000 | (4) | ||||||||||||||||||||||
|
|
|
|
|
|
|
|
|
|
|
|
|
|||||||||||||||||||||
| 21 | 6,000 | 4,920 | $ | 75,979,461 | $ | 115,977,000 | $ | 120,077,120 | ||||||||||||||||||||||||
|
|
|
|
|
|
|
|
|
|
|
|
|
|||||||||||||||||||||
| (1) | Consists of the initial acquisition price (including the costs allocated to both tangible and intangible assets), plus subsequent improvements and other capitalized costs associated with the properties, and adjusted for depreciation and amortization accumulated through March 31, 2014. |
| (2) | As reported in our Annual Report on Form 10-K for the year ended December 31, 2013. |
| (3) | Represents values based on third-party appraisals performed between June 2013 and January 2014. |
| (4) | Valued at the purchase price paid. |
| (5) | Represents value based on third-party appraisal performed in April 2014. |
36
Real estate companies are required to record real estate using the historical cost basis of the real estate, and, as a result, the carrying value of the real estate does not change as the fair value of the assets change. Thus, a difficulty in owning shares of an asset-based company is determining the fair value of the assets so that stockholders can see the value of the assets increase or decrease over time. For this reason, we believe determining the fair value of our real estate assets is useful to our investors.
Calculation of NAV
To provide our stockholders with an estimate of the fair value of our real estate assets, we will estimate the fair value of our farm properties, expressed in terms of net asset value (“NAV”) per share, and provide that to our stockholders on a quarterly basis. NAV is a non-GAAP, supplemental measure of financial position of an equity REIT. NAV is calculated as total stockholders’ equity, adjusted for the increase or decrease in fair value of our real estate assets and encumbrances relative to their respective costs bases (“Estimated Net Worth”). Estimated Net Worth is then divided by our total common shares outstanding to calculate the NAV per share.
As of March 31, 2014, we estimate the NAV per share to be $14.03, as detailed below:
| Total assets |
$ | 91,623,638 | ||||||
| Less: net cost basis of tangible and intangible real estate assets |
(75,979,461 | ) | ||||||
| Plus: estimated fair value of property portfolio(1) |
120,077,120 | |||||||
|
|
|
|||||||
| Estimated fair value of total assets |
$ | 135,721,297 | ||||||
| Total liabilities |
43,678,452 | |||||||
| Less: book value of aggregate borrowings |
(41,431,998 | ) | ||||||
| Plus: fair value of aggregate borrowings(2) |
41,865,585 | |||||||
|
|
|
|||||||
| Estimated fair value of total liabilities |
44,112,039 | |||||||
|
|
|
|||||||
| Estimated Net Worth |
$ | 91,609,258 | ||||||
|
|
|
|||||||
| Shares outstanding |
6,530,264 | |||||||
|
|
|
|||||||
| Estimated NAV per share |
$ | 14.03 | ||||||
|
|
|
| (1) | Per current value basis presented in the table above. |
| (2) | Valued using a discounted cash flow model. |
Comparison of NAV, using the above definition, to similarly-titled measures for other REITs, may not necessarily be meaningful, due to possible differences in the application of the definition of NAV used by such REITs. In addition, please note that the trading price of our common shares may differ from the most recent NAV per share calculation. For example, while we estimated the NAV per share as of March 31, 2014, to be $14.03 per the calculation above, the closing price of our common stock on March 31, 2014, was $14.14, and it has traded between $11.81 and $14.50 per share subsequent to March 31, 2014.
While management believes the values presented reflect current market conditions, the ultimate amount realized on any asset will be based on the timing of such dispositions and the then-current market conditions. There can be no assurance that the ultimate realized value upon disposition of an asset will approximate the fair value above.
Determination of Fair Value
For properties acquired within 12 months prior to the date of valuation, the purchase price of the property is used as the current fair value. For real estate we acquired more than one year prior to the date of valuation, we have calculated the fair value by relying on estimates of fair market value of our real estate properties provided by independent, third-party appraisers. The appraisers used various methodologies to determine the fair value of our real estate on an “As Is” basis, including the sales comparison, income (using a discounted cash flow analysis) and cost approaches of valuation. In performing their analyses, the appraisers (i) performed site visits to the properties, (ii) discussed each property with our Adviser and reviewed property-level information, including, but not limited to, property operating data, prior appraisals (as available), existing lease agreements, farm acreage, location, access to water and water rights, potential for future development and other property-level information, and (iii) reviewed information from a variety of sources about regional market conditions applicable to each of our properties, including, but not limited to, recent sale prices of comparable farmland, market rents for similar farmland, estimated marketing and exposure time, market capitalization rates and the current economic environment, among others.
37
Some of the significant assumptions used in valuing our portfolio as of March 31, 2014, include land values per farmable acre, market rental rates per farmable acre and capitalization rates, among others. These assumptions were applied on a farm-by-farm basis and were selected based on several factors, including comparable land sales, surveys of both existing and current market rates, discussions with other brokers and farmers, soil quality, size, location and other factors deemed appropriate. A summary of these assumptions is provided in the following table:
| Range | Weighted | |||||||||||||||
| (Low - High) | Average | |||||||||||||||
| Land Value (per farmable acre) |
$ | 24,000 | – | $ | 85,000 | $ | 67,064 | |||||||||
| Market Rent (per farmable acre) |
$ | 1,200 | – | $ | 3,700 | $ | 3,013 | |||||||||
| Market Capitalization Rate |
4.35 | % | – | 5.00 | % | 4.50 | % | |||||||||
The table above applies only to the farmland portion of our portfolio and excludes assumptions made relating to farm-related property, such as coolers and box barns, and other structures on our properties, including horticulture, as their aggregate value was deemed to be immaterial in relation to that of the farmland.
Our Adviser reviews the appraisals, including the significant assumptions and inputs used in determining the appraised values, and considers any developments that may have occurred since the time the appraisals were performed. Developments considered that may have an impact on the fair value of our real estate include, but are not limited to, changes in tenant credit profiles; changes in lease terms, such as expirations and notices of non-renewals or to vacate; and potential asset sales, particularly those at prices different from the appraised values of our properties.
Management believes that the purchase prices of the 9 farms acquired during 2013 and the most recent appraisals available for the 12 farms acquired prior to 2013, which were performed between the periods of June 2013 and April 2014, fairly represent the current market values of the properties as of March 31, 2014, and, accordingly, did not make any adjustment to these values.
Further, using a discounted cash flow analysis, management determined that the fair value of all encumbrances on our properties as of March 31, 2014, was $41.9 million, as compared to a carrying value of $41.4 million. This adjustment is reflected in the calculation of NAV above.
We intend to report any adjustments to the values of our properties, as well as to the NAV, in this section on a periodic basis, but in no case less than annually. However, the determination of NAV is subjective and involves a number of assumptions, judgments and estimates, and minor inaccuracies in our assumptions may have a material impact on our overall portfolio valuation. In addition, many of the assumptions used are sensitive to market conditions and can change frequently. Changes in the market environment and other events that may occur during our ownership of these properties may cause the values reported above to vary from the actual fair value that may be obtained in the open market.
38
ITEM 3. QUANTITATIVE AND QUALITATIVE DISCLOSURES ABOUT MARKET RISK
Market risk includes risks that arise from changes in interest rates, foreign currency exchange rates, commodity prices, equity prices and other market changes that affect market-sensitive instruments. The primary market risk that we believe we are and will be exposed to is interest rate risk. While none of our existing leases contain escalations based on market interest rates, the interest rates on our existing borrowings are variable, and, in the case of the mortgage note payable, the interest rate adjusts only once every three years. Although we seek to mitigate this risk by structuring certain provisions into many of our leases, such as escalation clauses or adjusting the rent to prevailing market rents at two- to three-year intervals, these features do not eliminate this risk. To date, we have not entered into any derivative contracts to attempt to manage our exposure to interest rate fluctuations.
There have been no material changes in the quantitative and qualitative market risk disclosures for the three months ended March 31, 2014, from that disclosed in our Annual Report on Form 10-K for the fiscal year ended December 31, 2013, as filed with the SEC on February 24, 2014.
ITEM 4. CONTROLS AND PROCEDURES
Evaluation of Disclosure Controls and Procedures
As of March 31, 2014, our management, including our chief executive officer and chief financial officer, evaluated the effectiveness of the design and operation of our disclosure controls and procedures. Based on that evaluation, management, including the chief executive officer and chief financial officer, concluded that our disclosure controls and procedures were effective as of March 31, 2014, in providing a reasonable level of assurance that information we are required to disclose in reports that we file or submit under the Exchange Act is recorded, processed, summarized and reported within the time periods specified in applicable SEC rules and forms, including providing a reasonable level of assurance that information required to be disclosed by us in such reports is accumulated and communicated to our management, including our chief executive officer and our chief financial officer, as appropriate to allow timely decisions regarding required disclosure. However, in evaluating the disclosure controls and procedures, management recognized that any controls and procedures, no matter how well designed and operated can provide only reasonable assurance of necessarily achieving the desired control objectives, and management was required to apply its judgment in evaluating the cost-benefit relationship of possible controls and procedures.
Changes in Internal Control over Financial Reporting
There were no changes in our internal control over financial reporting that occurred during the quarter ended March 31, 2014, that have materially affected, or are reasonably likely to materially affect, our internal control over financial reporting.
39
We are not currently subject to any material legal proceedings, nor, to our knowledge, are any material legal proceedings threatened against us.
Our business is subject to certain risks and events that, if they occur, could adversely affect our financial condition and results of operations and the trading price of our securities. For a discussion of these risks, please refer to the section captioned “Item 1A. Risk Factors” in our Annual Report on Form 10-K for the year ended December 31, 2013, filed by us with the Securities and Exchange Commission on February 24, 2014. The risks described in our Annual Report are not the only risks we face. Additional risks and uncertainties not currently known to us or that we currently deem to be immaterial may materially and adversely affect our business, financial condition and/or operating results.
Item 2. Unregistered Sales of Equity Securities and Use of Proceeds
Sales of Unregistered Securities
Not applicable.
Issuer Purchases of Equity Securities
Not applicable.
Initial Public Offering
On January 28, 2013, we priced our IPO of 3,333,334 shares of our common stock, par value $0.001 per share, at a public offering price of $15.00 per share, which closed on January 31, 2013. Including the underwriters’ option to cover over-allotments, which was exercised on February 19, 2013, we issued a total of 3,780,264 shares, resulting in gross proceeds of $56.7 million and net proceeds, after deducting underwriting discounts and offering expenses borne by us, of approximately $51.3 million. As of March 31, 2014, we have invested approximately $37.9 million of the net proceeds received in connection with our IPO into new property acquisitions, and an additional $1.7 million has been expended or accrued for capital improvements on existing properties. In addition, as of March 31, 2014, $10.3 million has been used to make distributions to stockholders, and a portion was used for other general corporate purposes. As of March 31, 2014, there were no significant uninvested proceeds remaining from our IPO.
Item 3. Defaults Upon Senior Securities
Not applicable.
Item 4. Mine Safety Disclosures
Not applicable.
None.
40
EXHIBIT INDEX
| Exhibit |
Exhibit Description | |
| 3.1 | Articles of Incorporation of the Registrant, incorporated by reference to Exhibit 3.1 to Pre-Effective Amendment No. 2 to the Registration Statement on Form S-11 (File No. 333-183965), filed November 2, 2012. | |
| 3.2 | Amended and Restated Bylaws of the Registrant, incorporated by reference to Exhibit 3.2 to Pre-Effective Amendment No. 3 to the Registration Statement on Form S-11 (File No. 333-183965), filed November 15, 2012. | |
| 4.1 | Form of Common Stock Certificate of the Registrant, incorporated by reference to Exhibit 4.1 to Pre-Effective Amendment No. 4 to the Registration Statement on Form S-11 (File No. 333-183965), filed December 27, 2012. | |
| 11 | Computation of Per Share Earnings from Operations (included in the notes to the unaudited financial statements contained in this Report). | |
| 23.1 | Consents of Nicholson & Company, incorporated by reference to Exhibit 23.1 to the Annual Report on Form 10-K (File No. 001-35795), filed February 24, 2014. | |
| 23.2 | Consents of McGrath, Alderman & Associates, incorporated by reference to Exhibit 23.3 to the Annual Report on Form 10-K (File No. 001-35795), filed February 24, 2014. | |
| 23.3 | Consents of Borrell Consulting Services, incorporated by reference to Exhibit 23.4 to the Annual Report on Form 10-K (File No. 001-35795), filed February 24, 2014. | |
| 23.4 | Consent of Moss & Associates (filed herewith). | |
| 31.1 | Certification of Chief Executive Officer pursuant to Section 302 of the Sarbanes-Oxley Act of 2002 (filed herewith). | |
| 31.2 | Certification of Chief Financial Officer pursuant to Section 302 of the Sarbanes-Oxley Act of 2002 (filed herewith). | |
| 32.1 | Certification of Chief Executive Officer pursuant to Section 906 of the Sarbanes-Oxley Act of 2002 (furnished herewith). | |
| 32.2 | Certification of Chief Financial Officer pursuant to Section 906 of the Sarbanes-Oxley Act of 2002 (furnished herewith). | |
| 101.INS*** | XBRL Instance Document | |
| 101.SCH*** | XBRL Taxonomy Extension Schema Document | |
| 101.CAL*** | XBRL Taxonomy Extension Calculation Linkbase Document | |
| 101.LAB*** | XBRL Taxonomy Extension Label Linkbase Document | |
| 101.PRE*** | XBRL Taxonomy Extension Presentation Linkbase Document | |
| 101.DEF*** | XBRL Definition Linkbase | |
| *** | Attached as Exhibit 101 to this Quarterly Report on Form 10-Q are the following materials, formatted in XBRL (eXtensible Business Reporting Language): (i) the Condensed Consolidated Balance Sheets as of March 31, 2014, and December 31, 2013, (ii) the Condensed Consolidated Statements of Operations for the three months ended March 31, 2014 and 2013, (iii) the Condensed Consolidated Statements of Cash Flows for the three months ended March 31, 2014 and 2013 and (vi) the Notes to the Condensed Consolidated Financial Statements. |
Pursuant to Rule 406T of Regulation S-T, the Interactive Data Files on Exhibit 101 hereto are deemed not filed or part of a registration statement or prospectus for purposes of Sections 11 or 12 of the Securities Act of 1933, as amended, are deemed not filed for purposes of Section 18 of the Securities and Exchange Act of 1934, as amended, and otherwise are not subject to liability under those sections.
41
Pursuant to the requirements of the Securities Exchange Act of 1934, the registrant has duly caused this report to be signed on its behalf by the undersigned, thereunto duly authorized.
| Gladstone Land Corporation | ||||||
| Date: May 5, 2014 | By: | /s/ Danielle Jones | ||||
| Danielle Jones | ||||||
| Chief Financial Officer and Treasurer | ||||||
| Date: May 5, 2014 | By: | /s/ David Gladstone | ||||
| David Gladstone | ||||||
| Chief Executive Officer and Chairman of the Board of Directors | ||||||
42